Difference between revisions of "Template:Article of the week"
Shawndouglas (talk | contribs) (Updated article of the week text) |
Shawndouglas (talk | contribs) (Updated article of the week text) |
||
| (131 intermediate revisions by the same user not shown) | |||
| Line 1: | Line 1: | ||
<div style="float: left; margin: 0.5em 0.9em 0.4em 0em;">[[File:Fig1 | <div style="float: left; margin: 0.5em 0.9em 0.4em 0em;">[[File:Fig1 Bispo-Silva Geosciences23 13-11.png|240px]]</div> | ||
'''"[[Journal: | '''"[[Journal:Geochemical biodegraded oil classification using a machine learning approach|Geochemical biodegraded oil classification using a machine learning approach]]"''' | ||
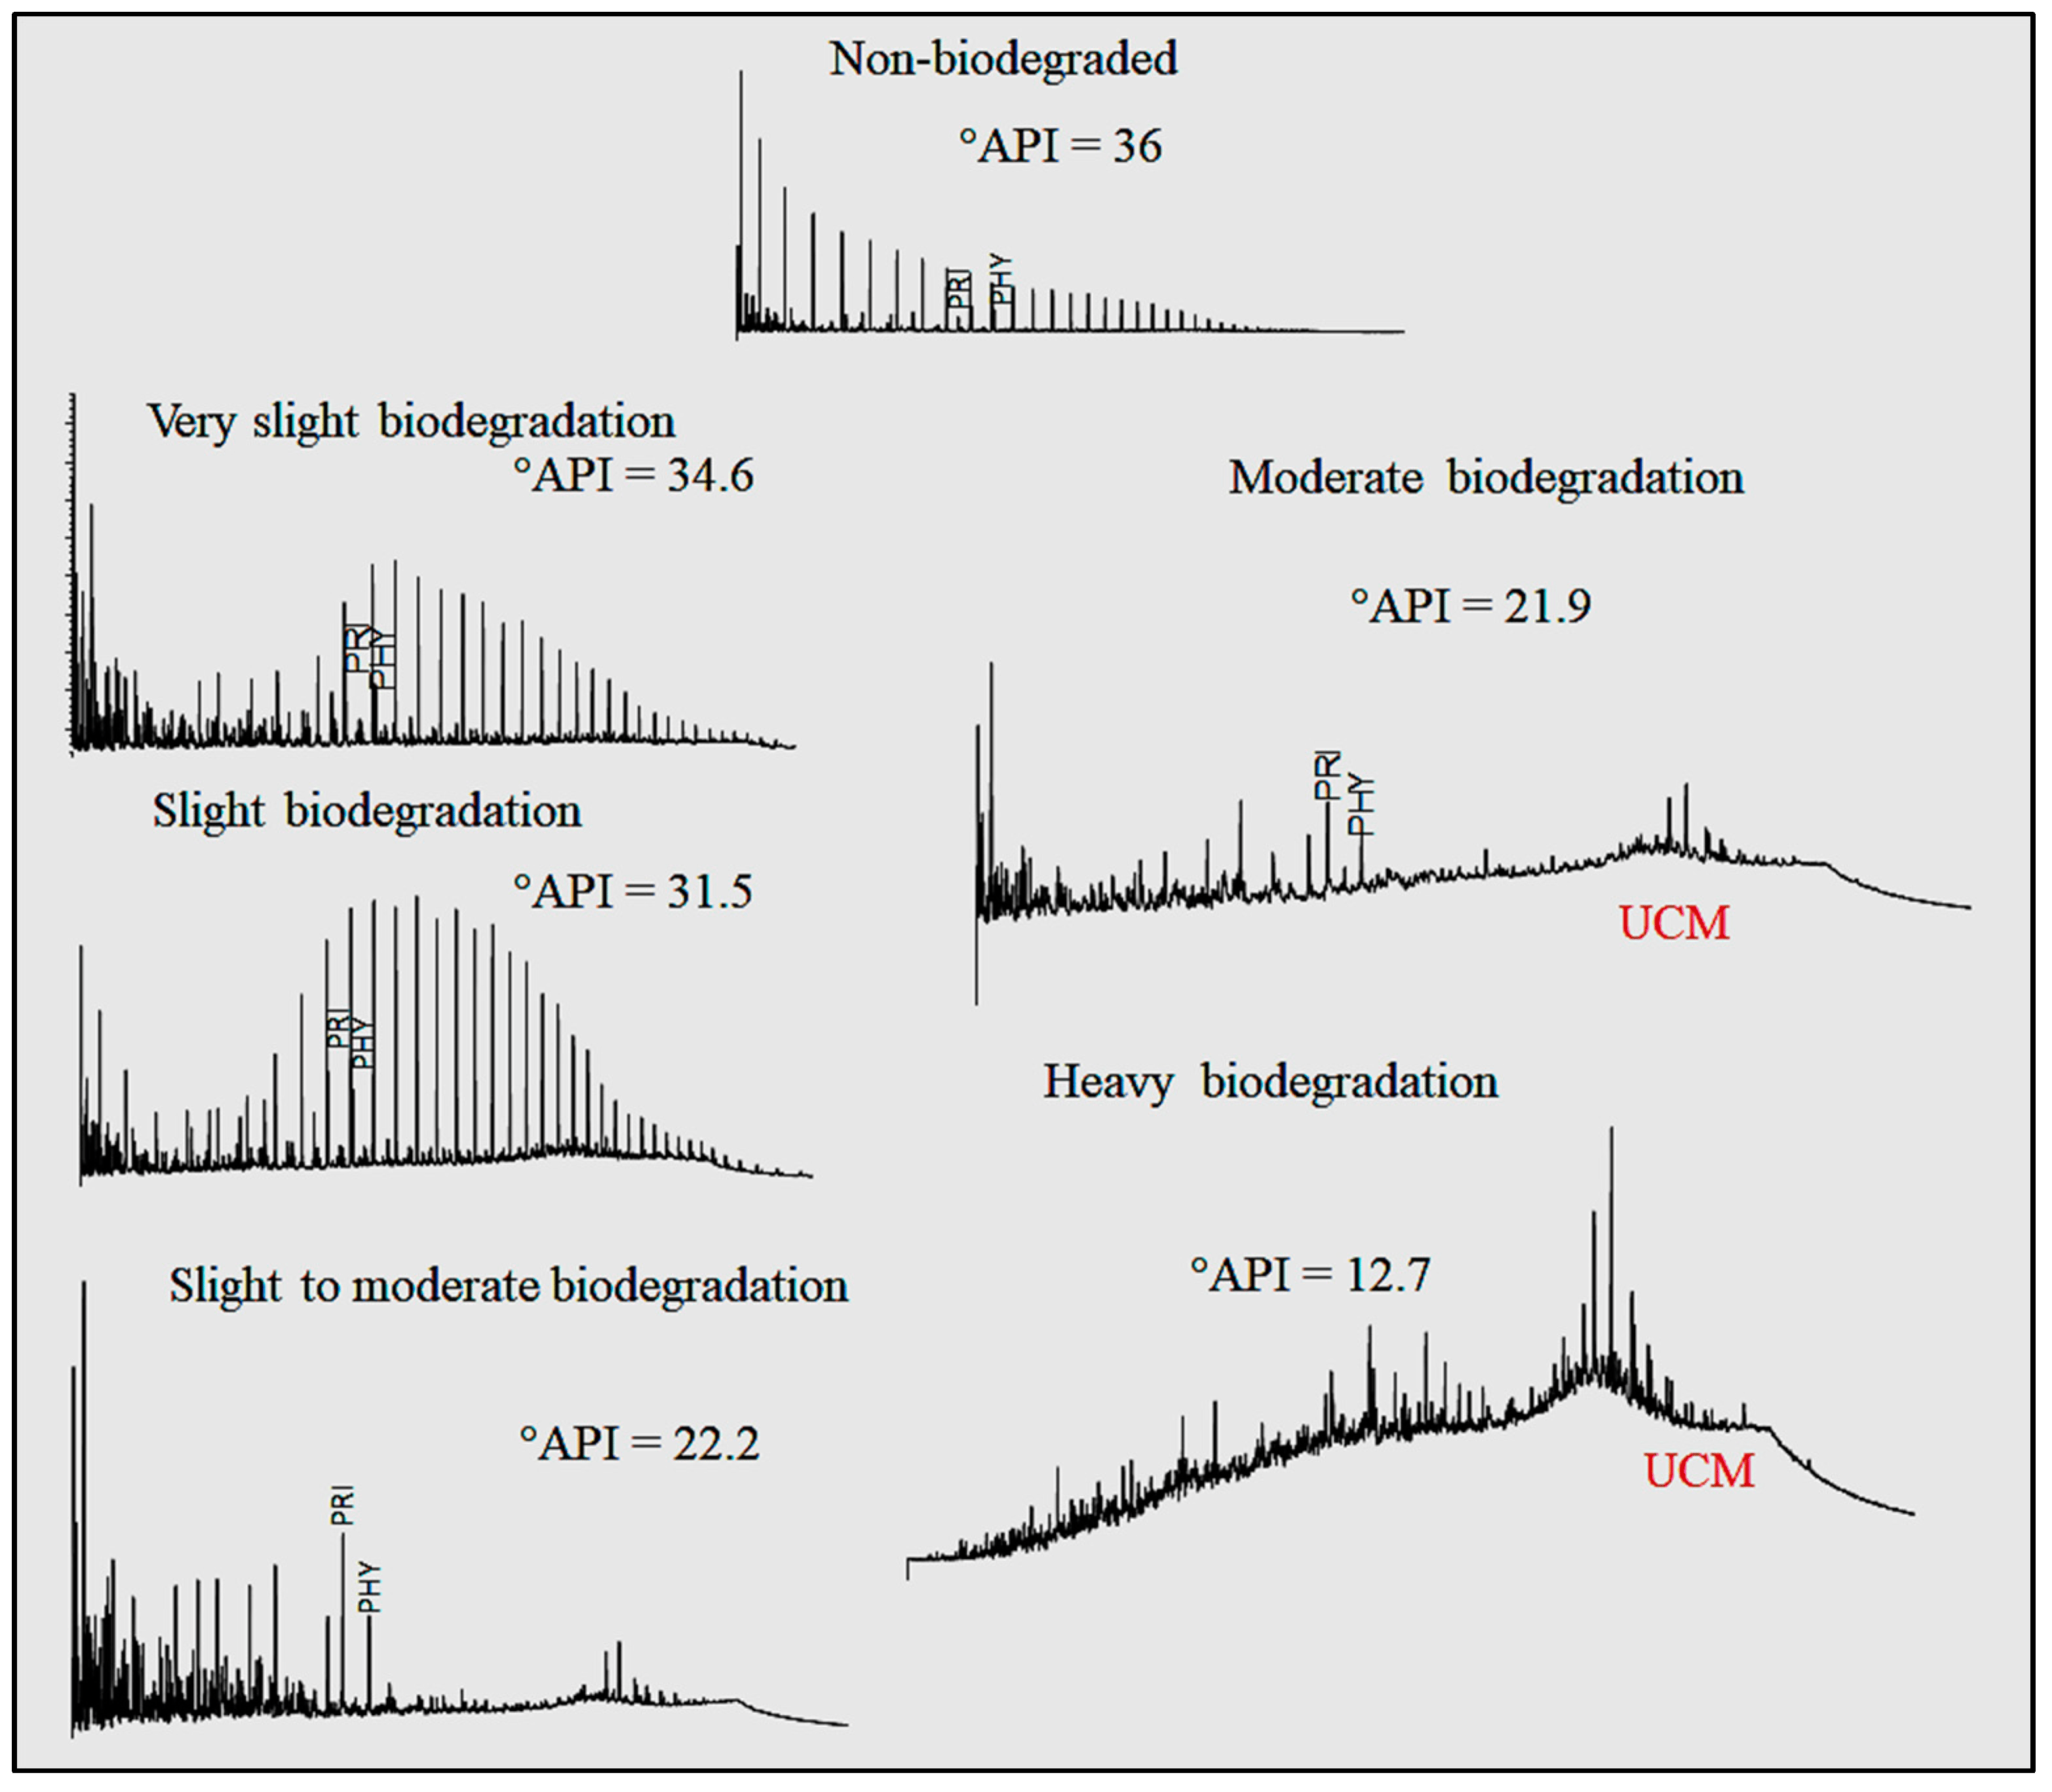
[[Chromatography|Chromatographic]] oil analysis is an important step for the identification of biodegraded petroleum via peak visualization and interpretation of phenomena that explain the oil geochemistry. However, analyses of chromatogram components by geochemists are comparative, visual, and consequently slow. This article aims to improve the chromatogram analysis process performed during geochemical interpretation by proposing the use of [[convolutional neural network]]s (CNN), which are deep learning techniques widely used by big tech companies. Two hundred and twenty-one (221) chromatographic oil images from different worldwide basins (Brazil, USA, Portugal, Angola, and Venezuela) were used. The [[open-source software]] Orange Data Mining was used to process images by CNN. The CNN algorithm extracts, pixel by pixel, recurring features from the images through convolutional operations ... ('''[[Journal:Geochemical biodegraded oil classification using a machine learning approach|Full article...]]''')<br /> | |||
<br /> | |||
''Recently featured'': | ''Recently featured'': | ||
{{flowlist | | {{flowlist | | ||
* [[Journal: | * [[Journal:Knowledge of internal quality control for laboratory tests among laboratory personnel working in a biochemistry department of a tertiary care center: A descriptive cross-sectional study|Knowledge of internal quality control for laboratory tests among laboratory personnel working in a biochemistry department of a tertiary care center: A descriptive cross-sectional study]] | ||
* [[Journal: | * [[Journal:Sigma metrics as a valuable tool for effective analytical performance and quality control planning in the clinical laboratory: A retrospective study|Sigma metrics as a valuable tool for effective analytical performance and quality control planning in the clinical laboratory: A retrospective study]] | ||
* [[Journal: | * [[Journal:Why do we need food systems informatics? Introduction to this special collection on smart and connected regional food systems|Why do we need food systems informatics? Introduction to this special collection on smart and connected regional food systems]] | ||
}} | }} | ||
Revision as of 13:37, 13 May 2024
"Geochemical biodegraded oil classification using a machine learning approach"
Chromatographic oil analysis is an important step for the identification of biodegraded petroleum via peak visualization and interpretation of phenomena that explain the oil geochemistry. However, analyses of chromatogram components by geochemists are comparative, visual, and consequently slow. This article aims to improve the chromatogram analysis process performed during geochemical interpretation by proposing the use of convolutional neural networks (CNN), which are deep learning techniques widely used by big tech companies. Two hundred and twenty-one (221) chromatographic oil images from different worldwide basins (Brazil, USA, Portugal, Angola, and Venezuela) were used. The open-source software Orange Data Mining was used to process images by CNN. The CNN algorithm extracts, pixel by pixel, recurring features from the images through convolutional operations ... (Full article...)
Recently featured:
- Knowledge of internal quality control for laboratory tests among laboratory personnel working in a biochemistry department of a tertiary care center: A descriptive cross-sectional study
- Sigma metrics as a valuable tool for effective analytical performance and quality control planning in the clinical laboratory: A retrospective study
- Why do we need food systems informatics? Introduction to this special collection on smart and connected regional food systems


