Difference between revisions of "File:Fig6 Ye JofPathInformatics2016 7.jpg"
Shawndouglas (talk | contribs) |
Shawndouglas (talk | contribs) (Added summary.) |
||
| Line 1: | Line 1: | ||
==Summary== | |||
{{Information | |||
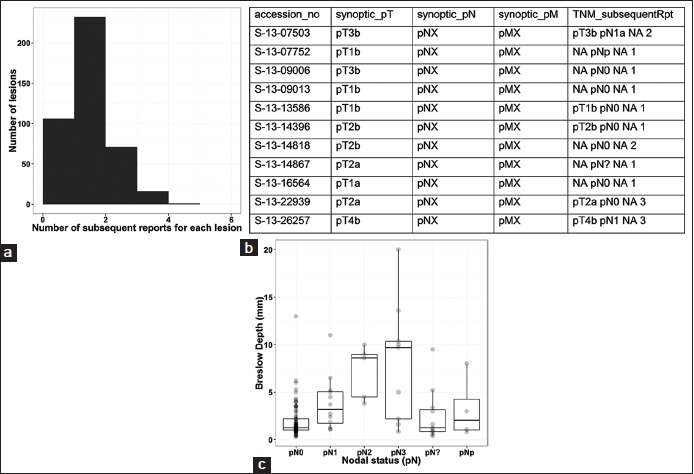
|Description='''Figure 6.''' (a) Distribution of the number of subsequent reports (within 120 days from the date of the synoptic report) for each synoptic report. (b) Microsoft Word table rendition showing portion of an R data frame containing a list of reports with subsequent reports containing staging information. "accession_no" is the accession number for the reports with synoptic reports. The number is modified to maintain the patient data confidentiality. "synoptic_pT," "synoptic_pN," and "synoptic_pM" are staging information extracted from the synoptic reports. "TNM_subsequentRpt" stores the pT, pN, and pM staging information retrieved from the subsequent report(s), as well as the number of subsequent reports associated with that lesion. (c) Relationship between the Breslow depth of melanoma and the nodal status. pN0, pN1, pN2, and pN3 are categories with precise pN information; pN? and pNp are categories with imprecise staging information, denoting nodal staging information present and node positive, respectively. The graph is the overlay of box plot with the actual data points. The bottom and top of the boxes are the first and third quartiles, and the band inside the box is the median. The whiskers extend to the most extreme data point that is not more than 1.5 times of the length of the box away from the box. | |||
|Source={{cite journal |journal=Journal of Pathology Informatics |title=Pathology report data extraction from relational database using R, with extraction from reports on melanoma of skin as an example |author=Ye, J.J. |volume=7 |pages=44 |year=2016 |doi=10.4103/2153-3539.192822}} | |||
|Author=Ye, J.J. | |||
|Date=2016 | |||
|Permission=[http://creativecommons.org/licenses/by-nc-sa/3.0/ Creative Commons Attribution-NonCommercial-ShareAlike 3.0 Unported] | |||
}} | |||
== Licensing == | == Licensing == | ||
{{cc-by-nc-sa-3.0}} | {{cc-by-nc-sa-3.0}} | ||
Latest revision as of 22:53, 16 November 2016
Summary
| Description |
Figure 6. (a) Distribution of the number of subsequent reports (within 120 days from the date of the synoptic report) for each synoptic report. (b) Microsoft Word table rendition showing portion of an R data frame containing a list of reports with subsequent reports containing staging information. "accession_no" is the accession number for the reports with synoptic reports. The number is modified to maintain the patient data confidentiality. "synoptic_pT," "synoptic_pN," and "synoptic_pM" are staging information extracted from the synoptic reports. "TNM_subsequentRpt" stores the pT, pN, and pM staging information retrieved from the subsequent report(s), as well as the number of subsequent reports associated with that lesion. (c) Relationship between the Breslow depth of melanoma and the nodal status. pN0, pN1, pN2, and pN3 are categories with precise pN information; pN? and pNp are categories with imprecise staging information, denoting nodal staging information present and node positive, respectively. The graph is the overlay of box plot with the actual data points. The bottom and top of the boxes are the first and third quartiles, and the band inside the box is the median. The whiskers extend to the most extreme data point that is not more than 1.5 times of the length of the box away from the box. |
|---|---|
| Source |
Ye, J.J. (2016). "Pathology report data extraction from relational database using R, with extraction from reports on melanoma of skin as an example". Journal of Pathology Informatics 7: 44. doi:10.4103/2153-3539.192822. |
| Date |
2016 |
| Author |
Ye, J.J. |
| Permission (Reusing this file) |
Creative Commons Attribution-NonCommercial-ShareAlike 3.0 Unported |
| Other versions |
Licensing
|
|
This work is licensed under the Creative Commons Attribution-NonCommercial-ShareAlike 3.0 Unported License. |
File history
Click on a date/time to view the file as it appeared at that time.
| Date/Time | Thumbnail | Dimensions | User | Comment | |
|---|---|---|---|---|---|
| current | 22:51, 16 November 2016 |  | 694 × 474 (81 KB) | Shawndouglas (talk | contribs) |
You cannot overwrite this file.
File usage
The following page uses this file:


