Difference between revisions of "File:Fig2 Krantz FrontPlantSci2021 12.jpg"
Shawndouglas (talk | contribs) |
Shawndouglas (talk | contribs) (Added summary.) |
||
| Line 1: | Line 1: | ||
==Summary== | |||
{{Information | |||
|Description='''Figure 2.''' An artificial neural network. Information, i.e., x<sub>1</sub>, x<sub>2</sub>, and x<sub>3</sub>, enters the network via the input layer (layer 1, blue). Weights w<sub>ij</sub> determine the quantity by which information is passed to layer 2 (hidden, green). Processed information, here y<sub>1n</sub> and y<sub>2n</sub>, leaves the network by the output layer (layer n, yellow). Indices refer to neuron number and layer number, respectively. Calculations for neurons are depicted exemplarily for h<sub>12</sub> (first neuron in second layer), which is composed of a bias (b<sub>12</sub>) and summed information of the previous layer, here layer 1. Resulting information, y<sub>12</sub>, is passed to the next layer and might comprise nonlinearities in f(h<sub>12</sub>). Deep neural networks typically comprise several and up to numerous hidden layers, indicated in grey. | |||
|Source={{cite journal |title=Data management and modeling in plant biology |journal=Frontiers in Plant Science |author=Krantz, M.; Zimmer, D.; Adler, S.O.; Kitashova, A.; Klipp, E.; Mühlhaus, T.; Nägele, T. |volume=12 |at=717958 |year=2021 |doi=10.3389/fpls.2021.717958}} | |||
|Author=Krantz, M.; Zimmer, D.; Adler, S.O.; Kitashova, A.; Klipp, E.; Mühlhaus, T.; Nägele, T. | |||
|Date=2021 | |||
|Permission=[http://creativecommons.org/licenses/by/4.0/ Creative Commons Attribution 4.0 International] | |||
}} | |||
== Licensing == | == Licensing == | ||
{{cc-by-4.0}} | {{cc-by-4.0}} | ||
Latest revision as of 22:41, 17 December 2021
Summary
| Description |
Figure 2. An artificial neural network. Information, i.e., x1, x2, and x3, enters the network via the input layer (layer 1, blue). Weights wij determine the quantity by which information is passed to layer 2 (hidden, green). Processed information, here y1n and y2n, leaves the network by the output layer (layer n, yellow). Indices refer to neuron number and layer number, respectively. Calculations for neurons are depicted exemplarily for h12 (first neuron in second layer), which is composed of a bias (b12) and summed information of the previous layer, here layer 1. Resulting information, y12, is passed to the next layer and might comprise nonlinearities in f(h12). Deep neural networks typically comprise several and up to numerous hidden layers, indicated in grey. |
|---|---|
| Source |
Krantz, M.; Zimmer, D.; Adler, S.O.; Kitashova, A.; Klipp, E.; Mühlhaus, T.; Nägele, T. (2021). "Data management and modeling in plant biology". Frontiers in Plant Science 12: 717958. doi:10.3389/fpls.2021.717958. |
| Date |
2021 |
| Author |
Krantz, M.; Zimmer, D.; Adler, S.O.; Kitashova, A.; Klipp, E.; Mühlhaus, T.; Nägele, T. |
| Permission (Reusing this file) |
|
| Other versions |
Licensing
|
|
This work is licensed under the Creative Commons Attribution 4.0 License. |
File history
Click on a date/time to view the file as it appeared at that time.
| Date/Time | Thumbnail | Dimensions | User | Comment | |
|---|---|---|---|---|---|
| current | 22:37, 17 December 2021 | 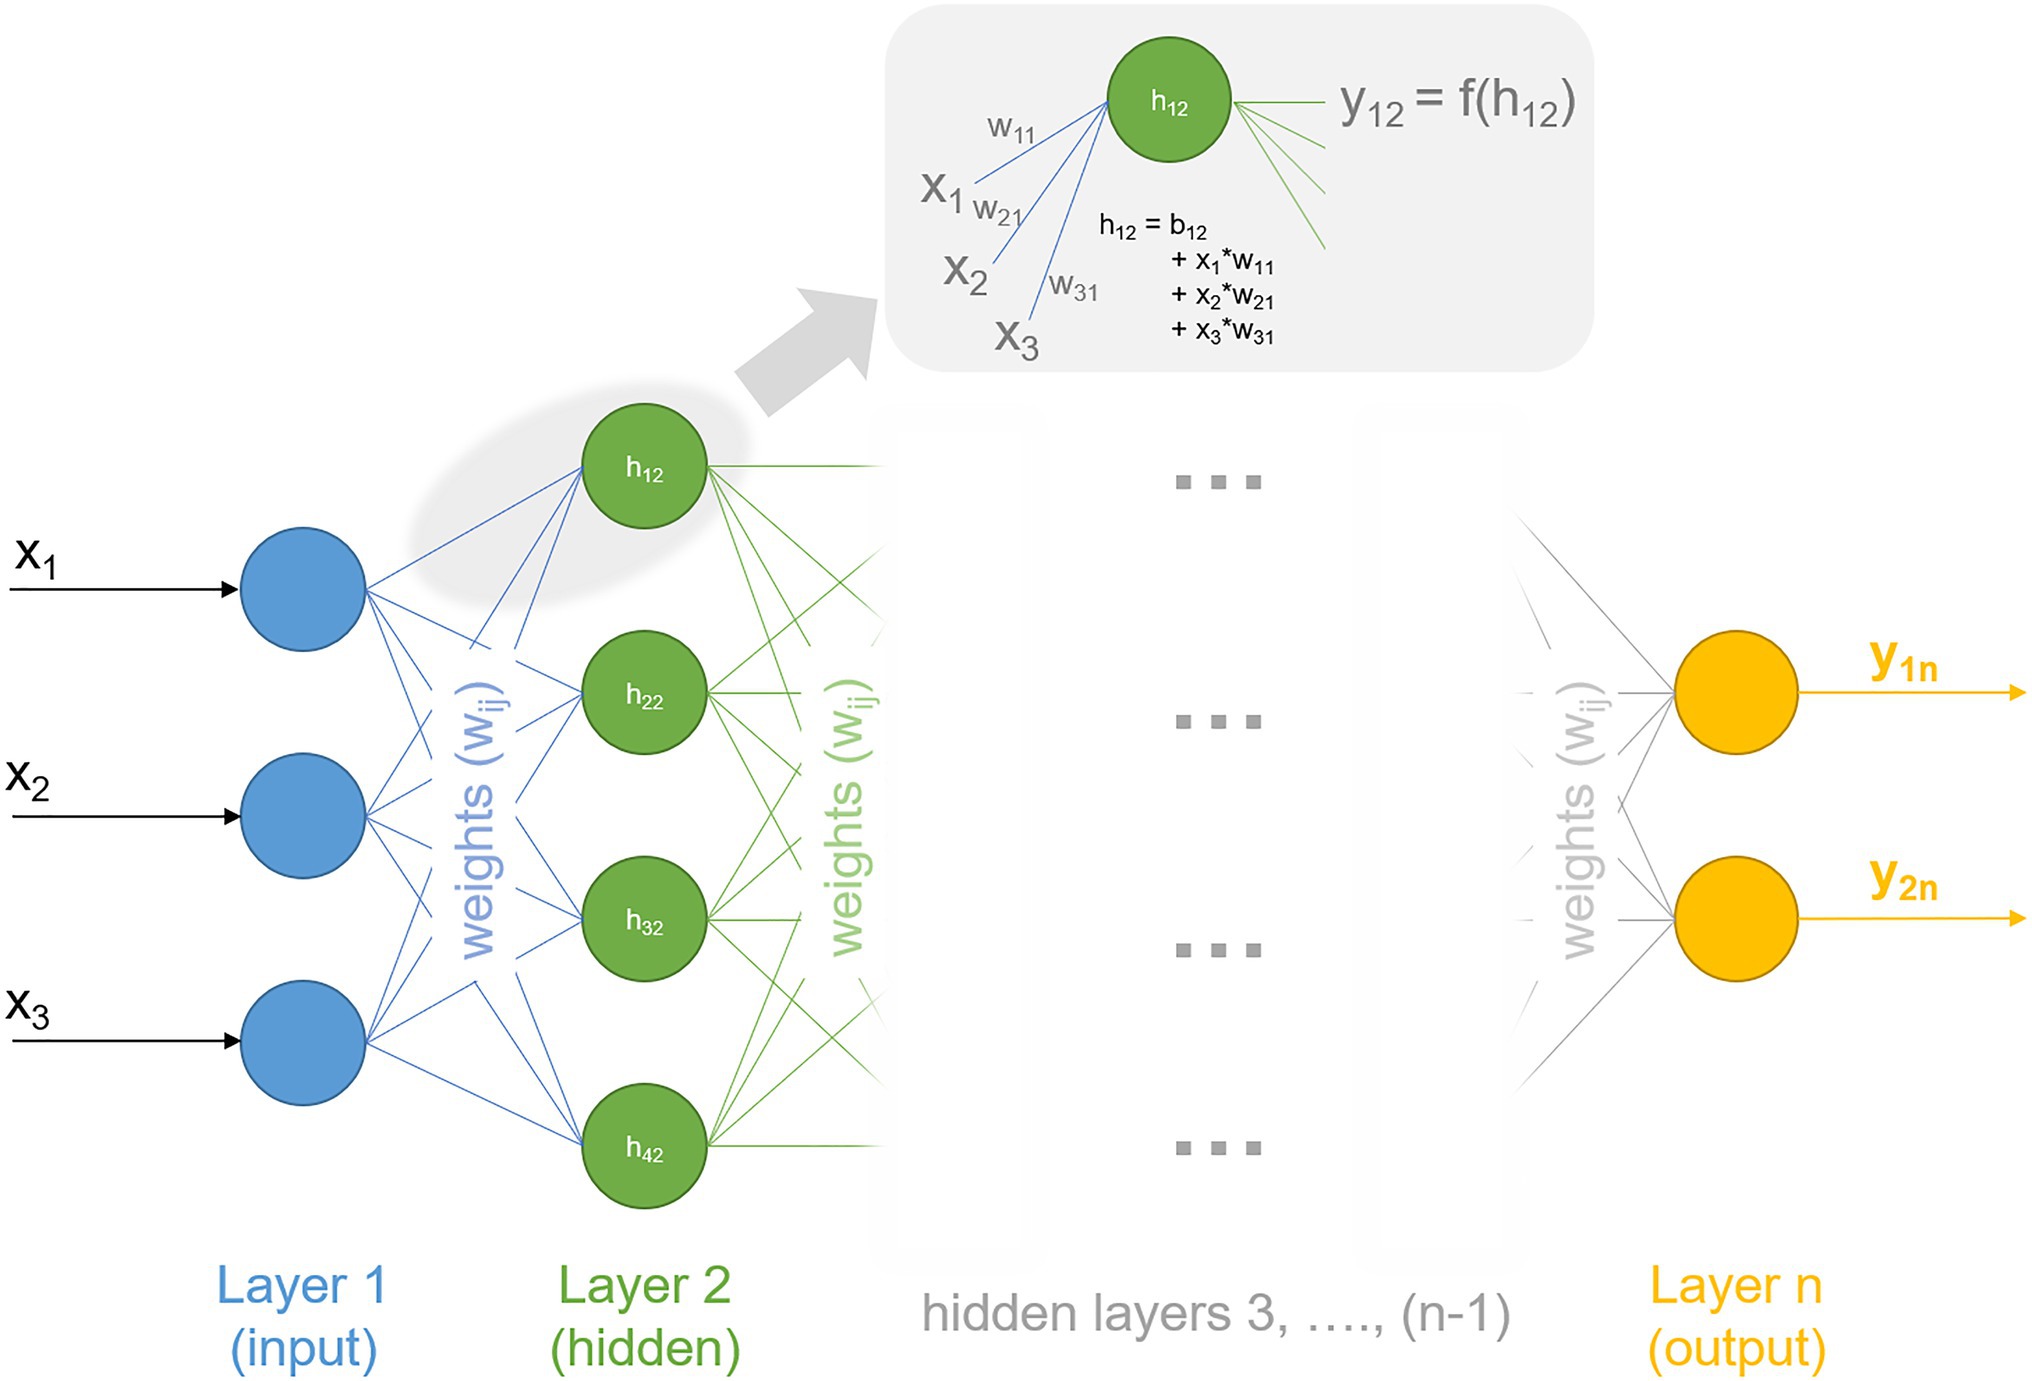 | 2,032 × 1,381 (201 KB) | Shawndouglas (talk | contribs) |
You cannot overwrite this file.
File usage
The following page uses this file:


