Difference between revisions of "File:Fig3 Signoroni NatComm23 14.png"
Shawndouglas (talk | contribs) |
Shawndouglas (talk | contribs) (Added summary.) |
||
| Line 1: | Line 1: | ||
==Summary== | |||
{{Information | |||
|Description='''Figure 3.''' '''a''' 32 × 32 confusion matrix for single colony species ID (in absolute value). Phylogenetic group subdivisions are indicated with black lines. '''b''' 16 × 16 confusion matrix for single colony phylogenic group ID (in relative value referred to the group-based GT). '''c''' 32 × 32 matrix indicating relative increase/decrease (in absolute value and referred to '''a''') after similarity-based smoothing. '''d''' 3D 16 × 16 matrix with column height indicating relative increment (blue)/decrement (pink) referred to baseline (green) matrix '''b'''. Source data are provided as a Source Data file. | |||
|Source={{cite journal |title=Hierarchical AI enables global interpretation of culture plates in the era of digital microbiology |journal=Nature Communications |author=Signoroni, Alberto; Ferrari, Alessandro; Lombardi, Stefano; Savardi, Mattia; Fontana, Stefania; Culbreath, Karissa |volume=14 |at=6874 |year=2023 |doi=10.1038/s41467-023-42563-1}} | |||
|Author=Signoroni, Alberto; Ferrari, Alessandro; Lombardi, Stefano; Savardi, Mattia; Fontana, Stefania; Culbreath, Karissa | |||
|Date=2023 | |||
|Permission=[https://creativecommons.org/licenses/by/4.0/ Creative Commons Attribution 4.0 International] | |||
}} | |||
== Licensing == | == Licensing == | ||
{{cc-by-4.0}} | {{cc-by-4.0}} | ||
Latest revision as of 17:06, 3 March 2024
Summary
| Description |
Figure 3. a 32 × 32 confusion matrix for single colony species ID (in absolute value). Phylogenetic group subdivisions are indicated with black lines. b 16 × 16 confusion matrix for single colony phylogenic group ID (in relative value referred to the group-based GT). c 32 × 32 matrix indicating relative increase/decrease (in absolute value and referred to a) after similarity-based smoothing. d 3D 16 × 16 matrix with column height indicating relative increment (blue)/decrement (pink) referred to baseline (green) matrix b. Source data are provided as a Source Data file. |
|---|---|
| Source |
Signoroni, Alberto; Ferrari, Alessandro; Lombardi, Stefano; Savardi, Mattia; Fontana, Stefania; Culbreath, Karissa (2023). "Hierarchical AI enables global interpretation of culture plates in the era of digital microbiology". Nature Communications 14: 6874. doi:10.1038/s41467-023-42563-1. |
| Date |
2023 |
| Author |
Signoroni, Alberto; Ferrari, Alessandro; Lombardi, Stefano; Savardi, Mattia; Fontana, Stefania; Culbreath, Karissa |
| Permission (Reusing this file) |
|
| Other versions |
Licensing
|
|
This work is licensed under the Creative Commons Attribution 4.0 License. |
File history
Click on a date/time to view the file as it appeared at that time.
| Date/Time | Thumbnail | Dimensions | User | Comment | |
|---|---|---|---|---|---|
| current | 17:02, 3 March 2024 | 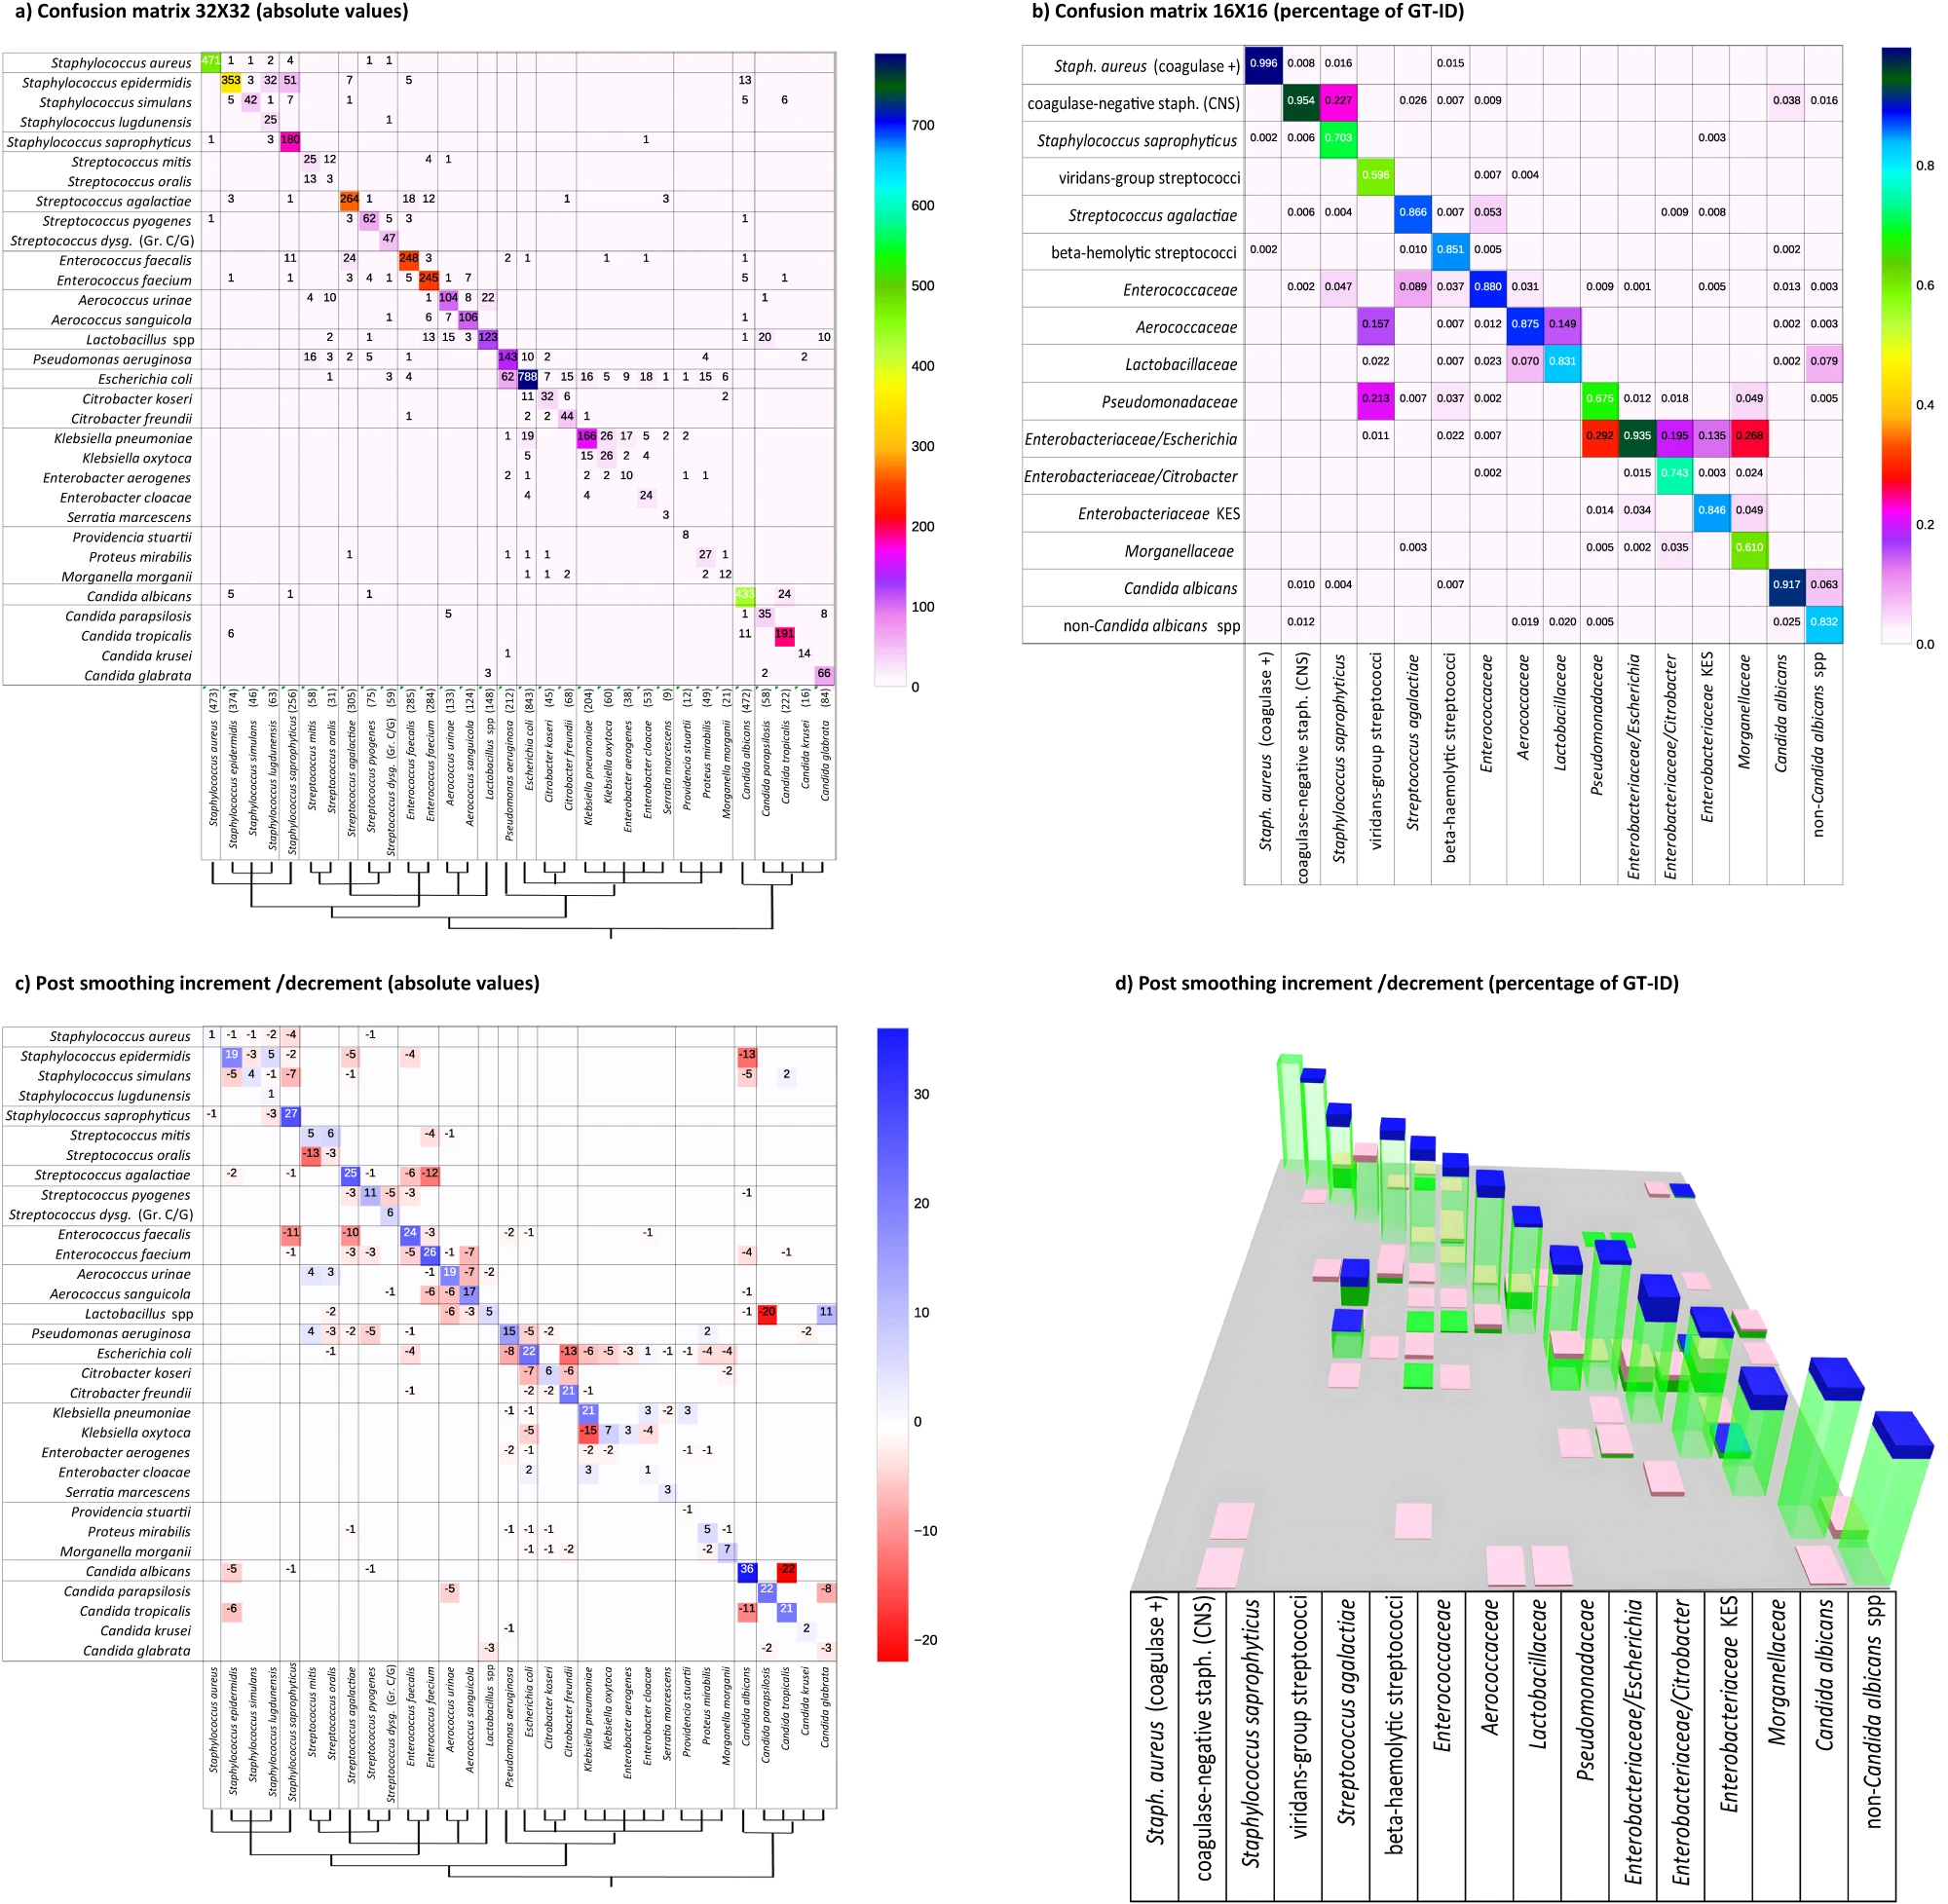 | 2,000 × 1,955 (1.73 MB) | Shawndouglas (talk | contribs) |
You cannot overwrite this file.
File usage
The following page uses this file:


