File:Fig2 Jikomes SciReports2018 8.jpg
Original file (900 × 1,109 pixels, file size: 146 KB, MIME type: image/jpeg)
Summary
| Description |
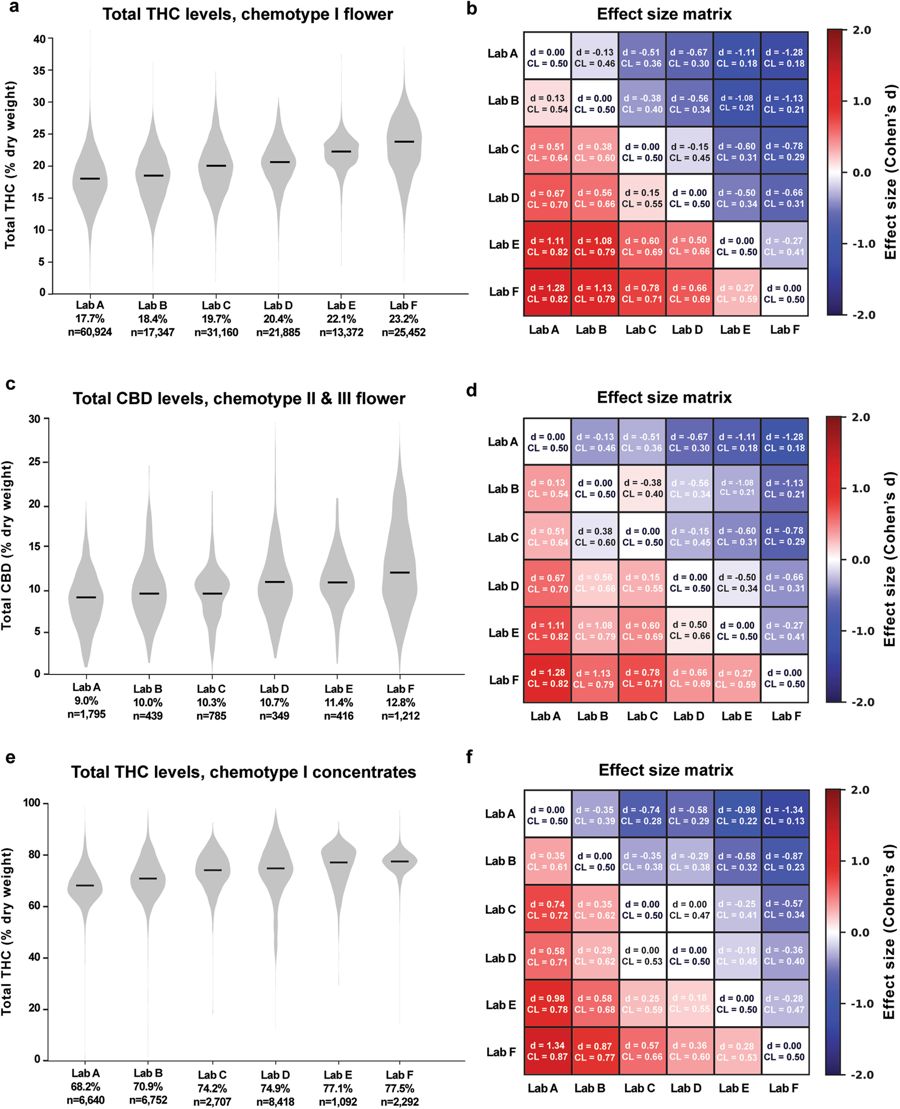
Figure 2. Total THC and CBD Measurements Differ Between Labs Across Chemotypes and Product Categories. Left column: Violin plots showing the distribution of total THC or CBD levels across labs A-F. Black lines denote median values, which are printed below the x-axis for each lab. Right column: Effect size matrices displaying the effect size of pairwise differences in distributions between labs. Matrices are color-coded according to one measure of effect size (Cohen’s d), and a second measure (Common Language) is printed for each comparison. |
|---|---|
| Source |
Jikomes, N.; Zoorob, M. (2018). "The cannabinoid content of legal cannabis in Washington State varies systematically across testing facilities and popular consumer products". Scientific Reports 8: 4519. doi:10.1038/s41598-018-22755-2. |
| Date |
2018 |
| Author |
Jikomes, N.; Zoorob, M. |
| Permission (Reusing this file) |
|
| Other versions |
Licensing
|
|
This work is licensed under the Creative Commons Attribution 4.0 License. |
File history
Click on a date/time to view the file as it appeared at that time.
| Date/Time | Thumbnail | Dimensions | User | Comment | |
|---|---|---|---|---|---|
| current | 21:30, 5 April 2019 | | 900 × 1,109 (146 KB) | Shawndouglas (talk | contribs) | {{Information |Description='''Figure 2.''' Total THC and CBD Measurements Differ Between Labs Across Chemotypes and Product Categories. Left column: Violin plots showing the distribution of total THC or CBD levels across labs A-F. Black lines denote me... |
You cannot overwrite this file.


