File:Fig2 Musio EnviroAdv2022 7.jpg
Original file (2,999 × 1,040 pixels, file size: 362 KB, MIME type: image/jpeg)
Summary
| Description |
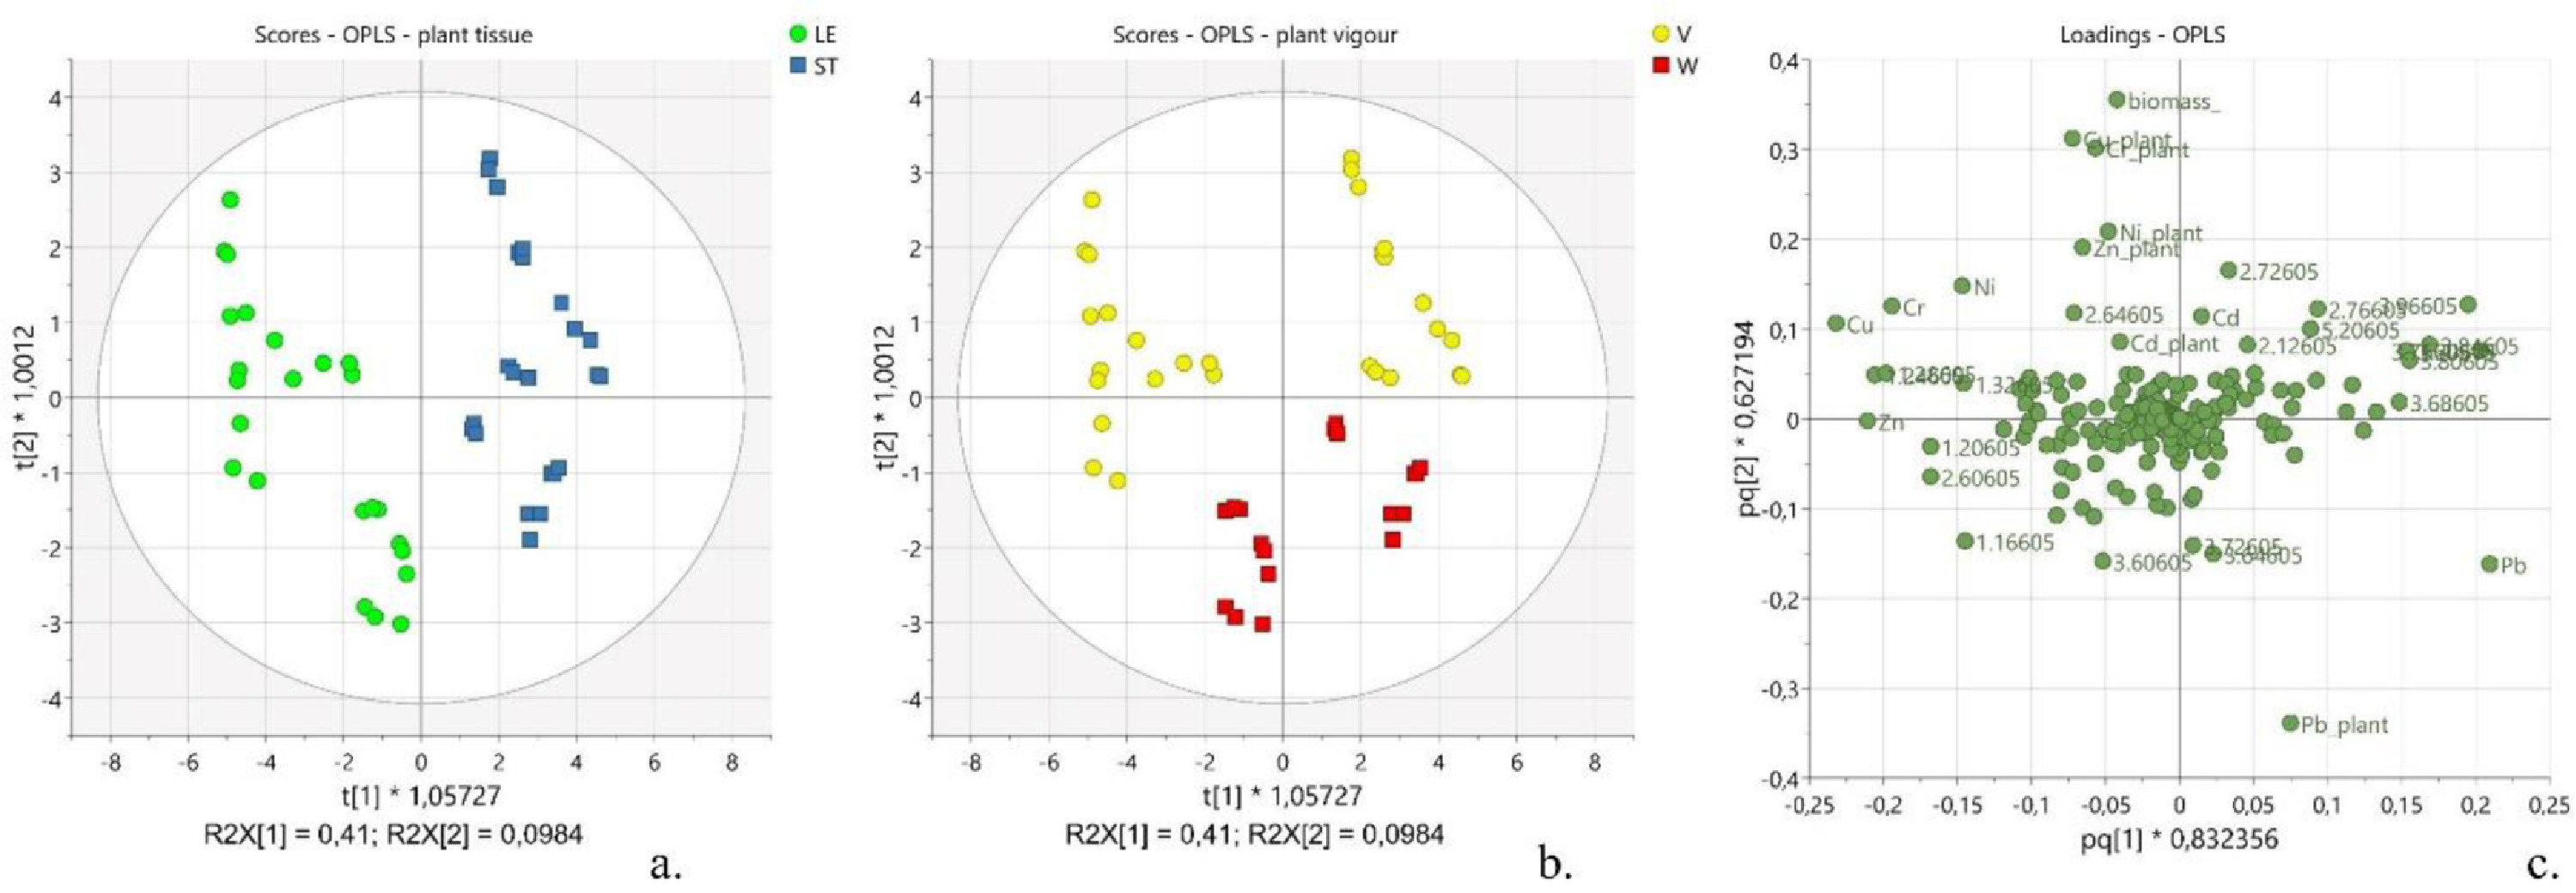
Fig. 2 OPLS-DA applied to spectral data (x-variables) and metal content and plant biomass data (y-variables). (a.) Scores plot displaying t[1] vs t[2], the observations are colored according to the tissues of the plants: leaves (green circle, LE), stems (blue square, ST). (b.) Scores plot t[1] vs t[2], the observations are colored according to the health status of the plants: vigorous (yellow circle, V), weak (red square, W). (c.) Loading plot displaying the relationship between the x-variables (spectral regions) and the y-variables (metal content and plant biomass) for the first and second predictive components pq[1] vs pq[2] (For interpretation of the references to color in this figure legend, the reader is referred to the web version of this article.). |
|---|---|
| Source |
Musio, B.; Ahmed, E.M.F.M.H.; Antonicelli, M.; Chiapperini, D.; Dursi, O.; Grieco, F.; Latronico, M.; Mastrorilli, P.; Ragone, R.; Settanni, R.; Triggiani, M.; Gallo, V. (2022). "A spectroscopic study to assess heavy metals absorption by a combined hemp-spirulina system from contaminated soil". Environmental Advances 7: 100144. doi:10.1016/j.envadv.2021.100144. |
| Date |
2022 |
| Author |
Cicaloni, V.; Salvini, L.; Vitalini, S.; Garzoli, S. |
| Permission (Reusing this file) |
Creative Commons Attribution-NonCommercial-NoDerivatives 4.0 International |
| Other versions |
Licensing
|
|
This work is licensed under the Creative Commons Attribution-NonCommercial-NoDerivatives 4.0 International License. |
File history
Click on a date/time to view the file as it appeared at that time.
| Date/Time | Thumbnail | Dimensions | User | Comment | |
|---|---|---|---|---|---|
| current | 21:50, 26 December 2023 | 2,999 × 1,040 (362 KB) | Shawndouglas (talk | contribs) |
You cannot overwrite this file.
File usage
The following page uses this file:


