Difference between revisions of "File:Fig2 Hatakeyama-Sato njpCompMat22 8.png"
Shawndouglas (talk | contribs) |
Shawndouglas (talk | contribs) (Added summary.) |
||
| Line 1: | Line 1: | ||
==Summary== | |||
{{Information | |||
|Description='''Fig. 2''' Electrolyte structures and conductivity. '''a''' Search space of chemical structures and major operations to prepare electrolytes. '''b''' Nyquist plot for a representative electrolyte, PPO/chloranil = 6/4 (mol/mol) with 30 wt % LiFTFSI. Inset: Photograph of the electrolyte layer. '''c''' Experimental ionic room temperature conductivities of the electrolytes. The samples were named using the format ‘XYZMM-NNαβ’, which indicates an electrolyte containing MM mol % donor (X = S: PMPS; O: PPO) versus acceptor (Y = L: chloranil; Q: benzoquinone; D: 2,3-dichloro-5,6-dicyano-''p''-benzoquinone) with NN wt % salt (Z = D: LiTFSI; M: LiFTFSI; N: LiFSI; B: LiBF<sub>4</sub>). Symbols α and β indicate operational conditions (α = H: thermal annealing before measurement; L: room temperature, and β = G: cells were kept in a glove box until measurement; O: kept outside). Box-plot elements are defined as follows. Center line: median, box limits: upper and lower quartiles, whiskers: 1.5x interquartile range, and points: outliers. Supplementary information, Supplementary Discussion g details the effects of the factors for conductivity. | |||
|Source={{cite journal |title=Exploration of organic superionic glassy conductors by process and materials informatics with lossless graph database |journal=npj Computational Materials |author=Hatakeyama-Sato, K.; Umeki, M.; Adachi, H.; Kuwata, N.; Hasegawa, G.; Oyaizu, K. |volume=8 |at=170 |year=2022 |doi=10.1038/s41524-022-00853-0}} | |||
|Author=Hatakeyama-Sato, K.; Umeki, M.; Adachi, H.; Kuwata, N.; Hasegawa, G.; Oyaizu, K. | |||
|Date=2022 | |||
|Permission=[http://creativecommons.org/licenses/by/4.0/ Creative Commons Attribution 4.0 International] | |||
}} | |||
== Licensing == | == Licensing == | ||
{{cc-by-4.0}} | {{cc-by-4.0}} | ||
Latest revision as of 21:24, 2 November 2022
Summary
| Description |
Fig. 2 Electrolyte structures and conductivity. a Search space of chemical structures and major operations to prepare electrolytes. b Nyquist plot for a representative electrolyte, PPO/chloranil = 6/4 (mol/mol) with 30 wt % LiFTFSI. Inset: Photograph of the electrolyte layer. c Experimental ionic room temperature conductivities of the electrolytes. The samples were named using the format ‘XYZMM-NNαβ’, which indicates an electrolyte containing MM mol % donor (X = S: PMPS; O: PPO) versus acceptor (Y = L: chloranil; Q: benzoquinone; D: 2,3-dichloro-5,6-dicyano-p-benzoquinone) with NN wt % salt (Z = D: LiTFSI; M: LiFTFSI; N: LiFSI; B: LiBF4). Symbols α and β indicate operational conditions (α = H: thermal annealing before measurement; L: room temperature, and β = G: cells were kept in a glove box until measurement; O: kept outside). Box-plot elements are defined as follows. Center line: median, box limits: upper and lower quartiles, whiskers: 1.5x interquartile range, and points: outliers. Supplementary information, Supplementary Discussion g details the effects of the factors for conductivity. |
|---|---|
| Source |
Hatakeyama-Sato, K.; Umeki, M.; Adachi, H.; Kuwata, N.; Hasegawa, G.; Oyaizu, K. (2022). "Exploration of organic superionic glassy conductors by process and materials informatics with lossless graph database". npj Computational Materials 8: 170. doi:10.1038/s41524-022-00853-0. |
| Date |
2022 |
| Author |
Hatakeyama-Sato, K.; Umeki, M.; Adachi, H.; Kuwata, N.; Hasegawa, G.; Oyaizu, K. |
| Permission (Reusing this file) |
|
| Other versions |
Licensing
|
|
This work is licensed under the Creative Commons Attribution 4.0 License. |
File history
Click on a date/time to view the file as it appeared at that time.
| Date/Time | Thumbnail | Dimensions | User | Comment | |
|---|---|---|---|---|---|
| current | 21:19, 2 November 2022 | 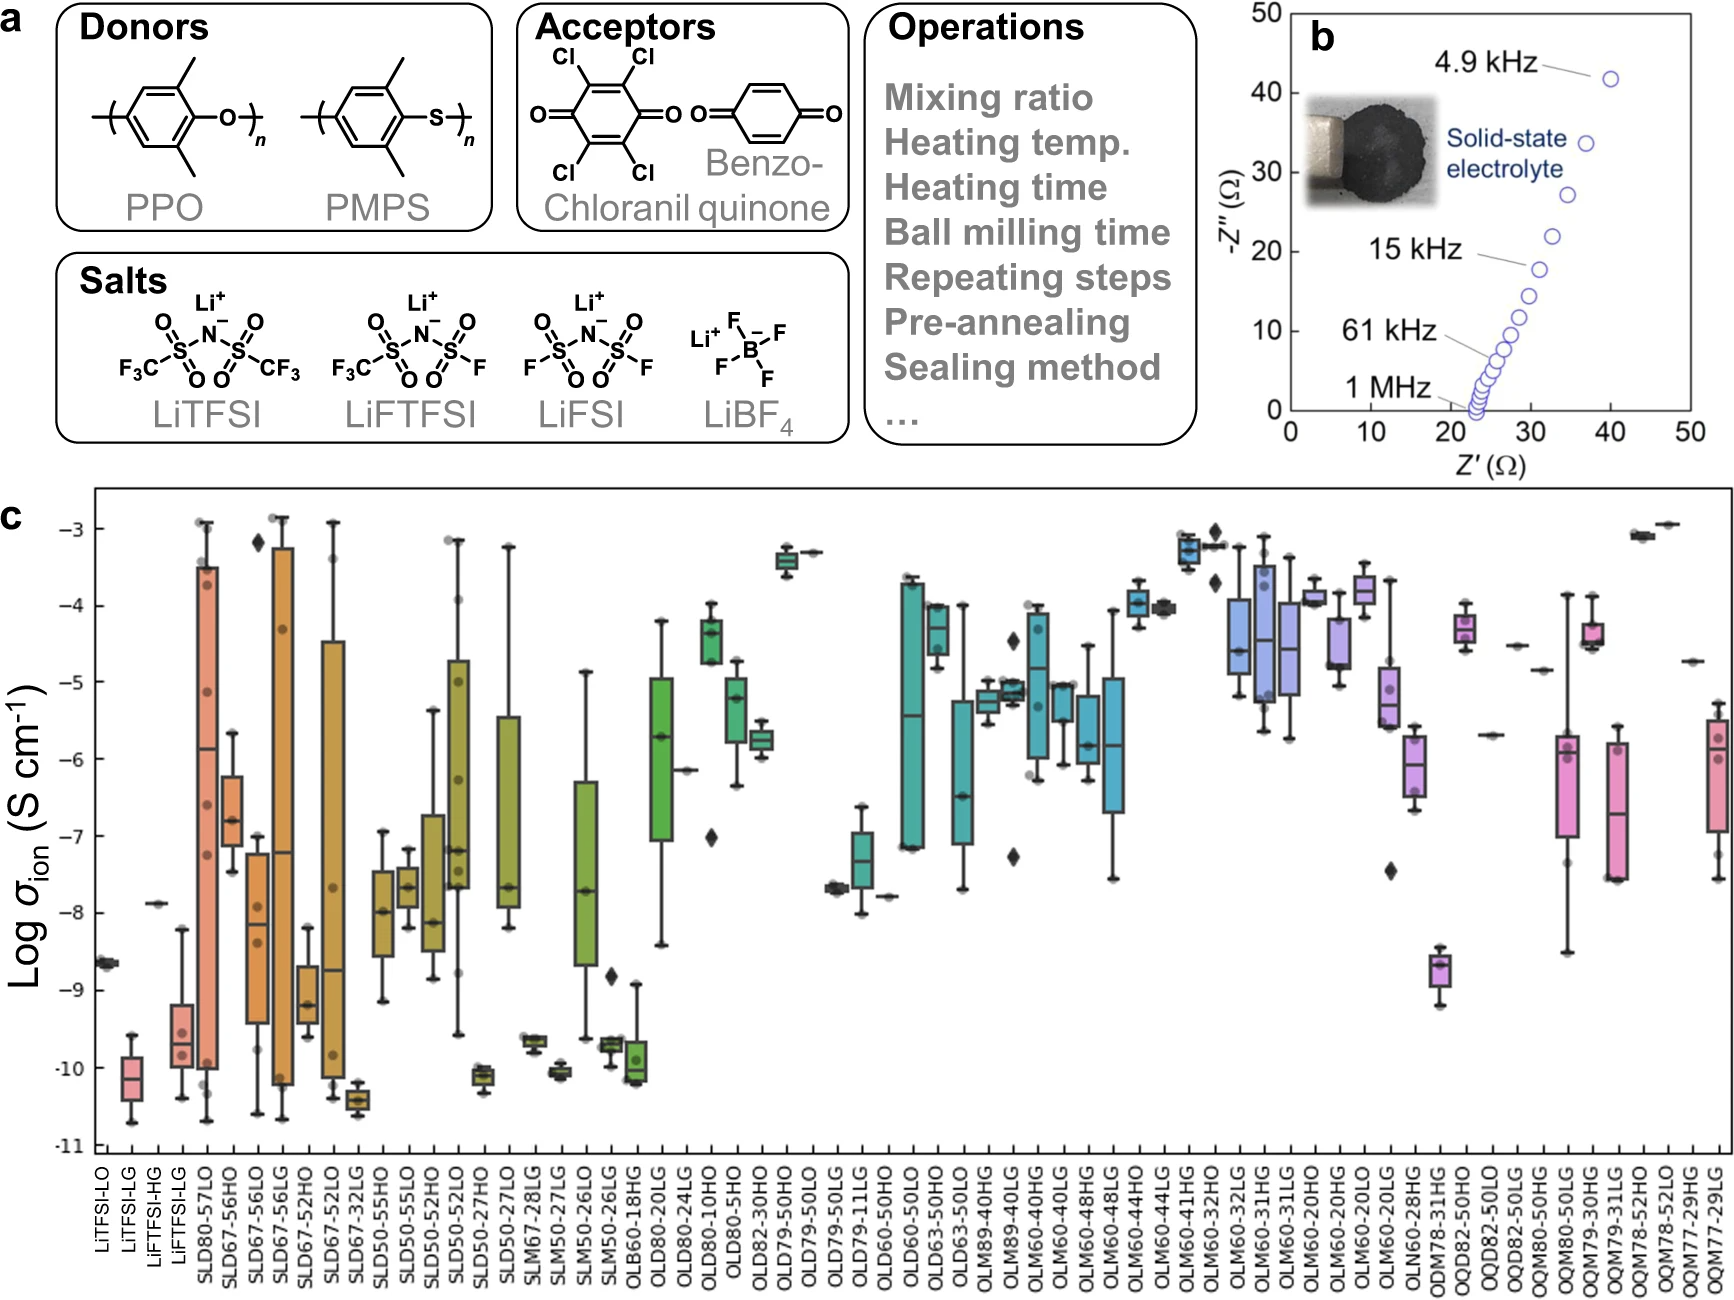 | 1,734 × 1,300 (816 KB) | Shawndouglas (talk | contribs) |
You cannot overwrite this file.
File usage
The following page uses this file:


