Difference between revisions of "File:Fig2 Naulaerts BioAndBioInsights2016 10.jpg"
Shawndouglas (talk | contribs) (Shawndouglas uploaded a new version of File:Fig2 Naulaerts BioAndBioInsights2016 10.jpg) |
Shawndouglas (talk | contribs) (Added summary.) |
||
| Line 1: | Line 1: | ||
==Summary== | |||
{{Information | |||
|Description='''Figure 2.''' Input (left) and output (right) of frequent itemset mining in popular frequent itemset mining implementations. The upper part shows the look and feel of the terminal-based Apriori Borgelt implementation. The output of this tool shows each pattern in turn on each line with the support value as a frequency between brackets. In the middle, a similar figure is shown for the arules package. The arules output is an R data object with the items that make up a pattern in one column and the support in the second column. The bottom of the figure features the input and output of MIME. Note here that the red dots in the upper whitespace indicate the items, which are described by their name and their individual support (between brackets). These items can be dragged and dropped in the larger white area below to modify the mining output. | |||
|Source={{cite journal |title=Practical approaches for mining frequent patterns in molecular datasets |journal=Bioinformatics and Biology Insights |author=Naulaerts, S.; Moens, S.; Engelen, K.; Vanden Berghe, W.; Goethals, B.; Laukens, K.; Meysman, P. |volume=10 |pages=37–47 |year=2016 |doi=10.4137/BBI.S38419 |pmid=27168722 |pmc=PMC4856181}} | |||
|Author=Naulaerts, S.; Moens, S.; Engelen, K.; Vanden Berghe, W.; Goethals, B.; Laukens, K.; Meysman, P. | |||
|Date=2016 | |||
|Permission=[https://creativecommons.org/licenses/by/3.0/ Creative Commons Attribution 3.0 Unported] | |||
}} | |||
== Licensing == | == Licensing == | ||
{{cc-by-3.0}} | {{cc-by-3.0}} | ||
Latest revision as of 15:04, 24 August 2016
Summary
| Description |
Figure 2. Input (left) and output (right) of frequent itemset mining in popular frequent itemset mining implementations. The upper part shows the look and feel of the terminal-based Apriori Borgelt implementation. The output of this tool shows each pattern in turn on each line with the support value as a frequency between brackets. In the middle, a similar figure is shown for the arules package. The arules output is an R data object with the items that make up a pattern in one column and the support in the second column. The bottom of the figure features the input and output of MIME. Note here that the red dots in the upper whitespace indicate the items, which are described by their name and their individual support (between brackets). These items can be dragged and dropped in the larger white area below to modify the mining output. |
|---|---|
| Source |
Naulaerts, S.; Moens, S.; Engelen, K.; Vanden Berghe, W.; Goethals, B.; Laukens, K.; Meysman, P. (2016). "Practical approaches for mining frequent patterns in molecular datasets". Bioinformatics and Biology Insights 10: 37–47. doi:10.4137/BBI.S38419. PMC PMC4856181. PMID 27168722. https://www.ncbi.nlm.nih.gov/pmc/articles/PMC4856181. |
| Date |
2016 |
| Author |
Naulaerts, S.; Moens, S.; Engelen, K.; Vanden Berghe, W.; Goethals, B.; Laukens, K.; Meysman, P. |
| Permission (Reusing this file) |
|
| Other versions |
Licensing
|
|
This work is licensed under the Creative Commons Attribution 3.0 Unported License. |
File history
Click on a date/time to view the file as it appeared at that time.
| Date/Time | Thumbnail | Dimensions | User | Comment | |
|---|---|---|---|---|---|
| current | 15:02, 24 August 2016 | 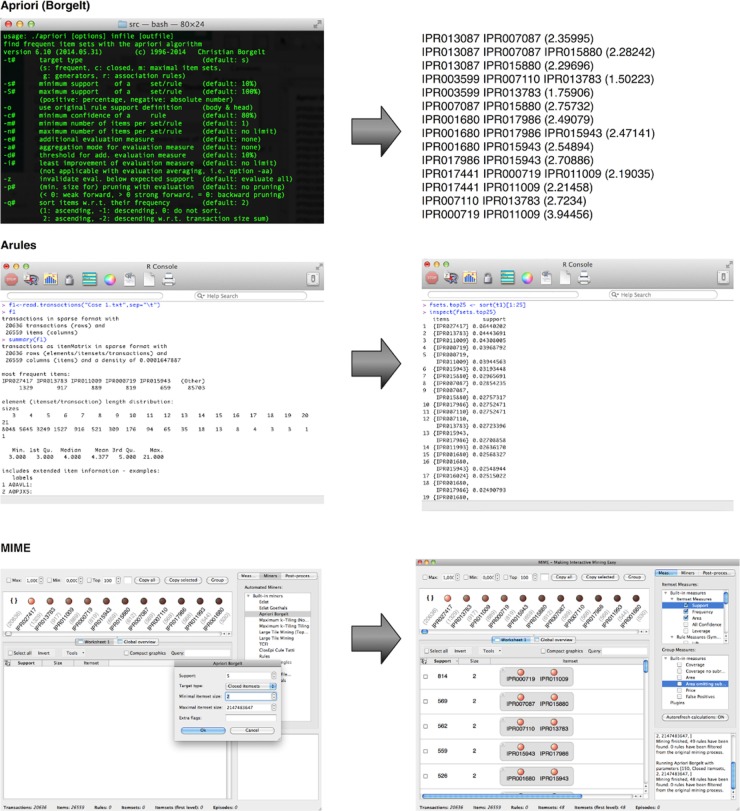 | 740 × 811 (190 KB) | Shawndouglas (talk | contribs) | Original version didn't download correctly |
| 15:01, 24 August 2016 |  | 256 × 256 (2 KB) | Shawndouglas (talk | contribs) |
You cannot overwrite this file.
File usage
The following page uses this file:


