Difference between revisions of "File:Fig2 Weemaes JAMIA2020 ocaa081.png"
Shawndouglas (talk | contribs) |
Shawndouglas (talk | contribs) (Added summary.) |
||
| Line 1: | Line 1: | ||
==Summary== | |||
{{Information | |||
|Description='''Fig. 2''' Graphical representation of key bottlenecks in coronavirus disease 2019 (COVID-19) sample flow. Gray boxes represent different stages in the laboratory analysis of COVID-19 samples. Stages have been group as preanalytical, analytical, and postanalytical phases. The box demarcated with a dotted line was newly implemented during the COVID-19 period. Maroon icons represent staff allocation before the COVID-19 pandemic, blue icons represent staff allocation during the COVID-19 pandemic (1 icon corresponds to 1 full-time equivalent [FTE]). Note, 30 of 38 additional pandemic-associated FTEs were assigned to administrative preanalytical– and postanalytical–related tasks. PCR: polymerase chain reaction. | |||
|Source={{cite journal |title=Laboratory information system requirements to manage the COVID-19 pandemic: A report from the Belgian national reference testing center |journal=Journal of the American Medical Informatics Association |author=Weemaes, M.; Martens, S.; Cuypers, L.; Van Elslande, J.; Hoet, K.; Welkenhuysen, J.; Goossens, R.; Wouters, S.; Houben, E.; Jeuris, K.; Laenen, L.; Bruyninckx, K.; Beuselinck, K.; André, E.; Depypere, M.; Desmet, S.; Lagrou, K.; Van Ranst, M.; Verdonck, A.K.L.C.; Goveia, J. |at=ocaa081 |year=2020 |doi=10.1093/jamia/ocaa081}} | |||
|Author=Weemaes, M.; Martens, S.; Cuypers, L.; Van Elslande, J.; Hoet, K.; Welkenhuysen, J.; Goossens, R.; Wouters, S.; Houben, E.; Jeuris, K.; Laenen, L.; Bruyninckx, K.; Beuselinck, K.; André, E.; Depypere, M.; Desmet, S.; Lagrou, K.; Van Ranst, M.; Verdonck, A.K.L.C.; Goveia, J. | |||
|Date=2020 | |||
|Permission=[http://creativecommons.org/licenses/by-nc/4.0/ Creative Commons Attribution Non-Commercial 4.0 International] | |||
}} | |||
== Licensing == | == Licensing == | ||
{{cc-by-nc-4.0}} | {{cc-by-nc-4.0}} | ||
Latest revision as of 15:27, 25 August 2020
Summary
| Description |
Fig. 2 Graphical representation of key bottlenecks in coronavirus disease 2019 (COVID-19) sample flow. Gray boxes represent different stages in the laboratory analysis of COVID-19 samples. Stages have been group as preanalytical, analytical, and postanalytical phases. The box demarcated with a dotted line was newly implemented during the COVID-19 period. Maroon icons represent staff allocation before the COVID-19 pandemic, blue icons represent staff allocation during the COVID-19 pandemic (1 icon corresponds to 1 full-time equivalent [FTE]). Note, 30 of 38 additional pandemic-associated FTEs were assigned to administrative preanalytical– and postanalytical–related tasks. PCR: polymerase chain reaction. |
|---|---|
| Source |
Weemaes, M.; Martens, S.; Cuypers, L.; Van Elslande, J.; Hoet, K.; Welkenhuysen, J.; Goossens, R.; Wouters, S.; Houben, E.; Jeuris, K.; Laenen, L.; Bruyninckx, K.; Beuselinck, K.; André, E.; Depypere, M.; Desmet, S.; Lagrou, K.; Van Ranst, M.; Verdonck, A.K.L.C.; Goveia, J. (2020). "Laboratory information system requirements to manage the COVID-19 pandemic: A report from the Belgian national reference testing center". Journal of the American Medical Informatics Association: ocaa081. doi:10.1093/jamia/ocaa081. |
| Date |
2020 |
| Author |
Weemaes, M.; Martens, S.; Cuypers, L.; Van Elslande, J.; Hoet, K.; Welkenhuysen, J.; Goossens, R.; Wouters, S.; Houben, E.; Jeuris, K.; Laenen, L.; Bruyninckx, K.; Beuselinck, K.; André, E.; Depypere, M.; Desmet, S.; Lagrou, K.; Van Ranst, M.; Verdonck, A.K.L.C.; Goveia, J. |
| Permission (Reusing this file) |
Creative Commons Attribution Non-Commercial 4.0 International |
| Other versions |
Licensing
|
|
This work is licensed under the Creative Commons Attribution-NonCommercial 4.0 International License. |
File history
Click on a date/time to view the file as it appeared at that time.
| Date/Time | Thumbnail | Dimensions | User | Comment | |
|---|---|---|---|---|---|
| current | 15:27, 25 August 2020 | 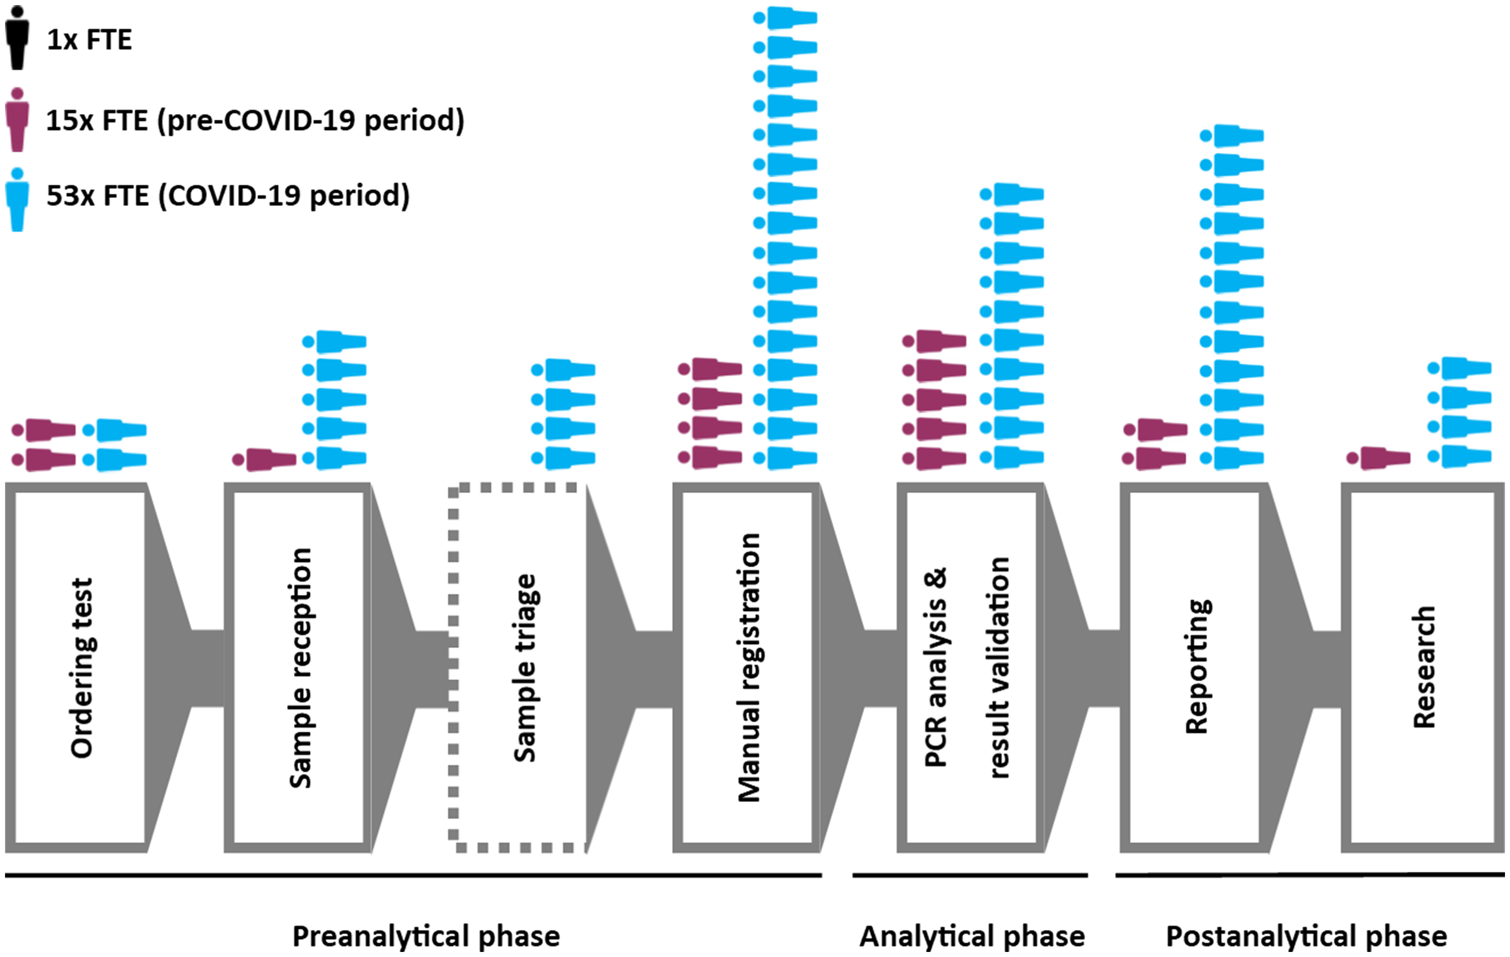 | 1,510 × 957 (245 KB) | Shawndouglas (talk | contribs) |
You cannot overwrite this file.
File usage
The following 2 pages use this file:


