Difference between revisions of "File:Fig3 Hatakeyama-Sato njpCompMat22 8.png"
Shawndouglas (talk | contribs) |
Shawndouglas (talk | contribs) (Added summary.) |
||
| Line 1: | Line 1: | ||
==Summary== | |||
{{Information | |||
|Description='''Fig. 3''' Automated feature analysis. '''a''' Conversion of process and measurement data into a numerical array. A full ML scheme is shown in Supplementary information, Supplementary Fig. 2. '''b''' Fingerprint generation from flowcharts. A binary array expresses specific experimental steps (e.g., in the figure, ‘Protocol A’ has steps a, b, c, and not c’ or d: this yields a fingerprint of 11100). ‘Cool’ steps in Protocol A and B are distinguished by c or c’ because only the latter is connected to ‘Stir’. Then, BERT and ''k''NN automatically group similar steps (e.g., ‘Heat’ and ‘Hot plate’ can be categorized in the same group). '''c''' Prediction of ionic conductivity (σ<sub>ion</sub>) using LightGBM regressor with statistically essential electrolyte parameters extracted by Boruta. '''d''' SHAP values during the prediction (explanations of parameters are shown in Supplementary information. Supplementary Table 2). '''e''' Causal relations estimated by unsupervised ML. | |||
|Source={{cite journal |title=Exploration of organic superionic glassy conductors by process and materials informatics with lossless graph database |journal=npj Computational Materials |author=Hatakeyama-Sato, K.; Umeki, M.; Adachi, H.; Kuwata, N.; Hasegawa, G.; Oyaizu, K. |volume=8 |at=170 |year=2022 |doi=10.1038/s41524-022-00853-0}} | |||
|Author=Hatakeyama-Sato, K.; Umeki, M.; Adachi, H.; Kuwata, N.; Hasegawa, G.; Oyaizu, K. | |||
|Date=2022 | |||
|Permission=[http://creativecommons.org/licenses/by/4.0/ Creative Commons Attribution 4.0 International] | |||
}} | |||
== Licensing == | == Licensing == | ||
{{cc-by-4.0}} | {{cc-by-4.0}} | ||
Latest revision as of 21:49, 2 November 2022
Summary
| Description |
Fig. 3 Automated feature analysis. a Conversion of process and measurement data into a numerical array. A full ML scheme is shown in Supplementary information, Supplementary Fig. 2. b Fingerprint generation from flowcharts. A binary array expresses specific experimental steps (e.g., in the figure, ‘Protocol A’ has steps a, b, c, and not c’ or d: this yields a fingerprint of 11100). ‘Cool’ steps in Protocol A and B are distinguished by c or c’ because only the latter is connected to ‘Stir’. Then, BERT and kNN automatically group similar steps (e.g., ‘Heat’ and ‘Hot plate’ can be categorized in the same group). c Prediction of ionic conductivity (σion) using LightGBM regressor with statistically essential electrolyte parameters extracted by Boruta. d SHAP values during the prediction (explanations of parameters are shown in Supplementary information. Supplementary Table 2). e Causal relations estimated by unsupervised ML. |
|---|---|
| Source |
Hatakeyama-Sato, K.; Umeki, M.; Adachi, H.; Kuwata, N.; Hasegawa, G.; Oyaizu, K. (2022). "Exploration of organic superionic glassy conductors by process and materials informatics with lossless graph database". npj Computational Materials 8: 170. doi:10.1038/s41524-022-00853-0. |
| Date |
2022 |
| Author |
Hatakeyama-Sato, K.; Umeki, M.; Adachi, H.; Kuwata, N.; Hasegawa, G.; Oyaizu, K. |
| Permission (Reusing this file) |
|
| Other versions |
Licensing
|
|
This work is licensed under the Creative Commons Attribution 4.0 License. |
File history
Click on a date/time to view the file as it appeared at that time.
| Date/Time | Thumbnail | Dimensions | User | Comment | |
|---|---|---|---|---|---|
| current | 21:45, 2 November 2022 | 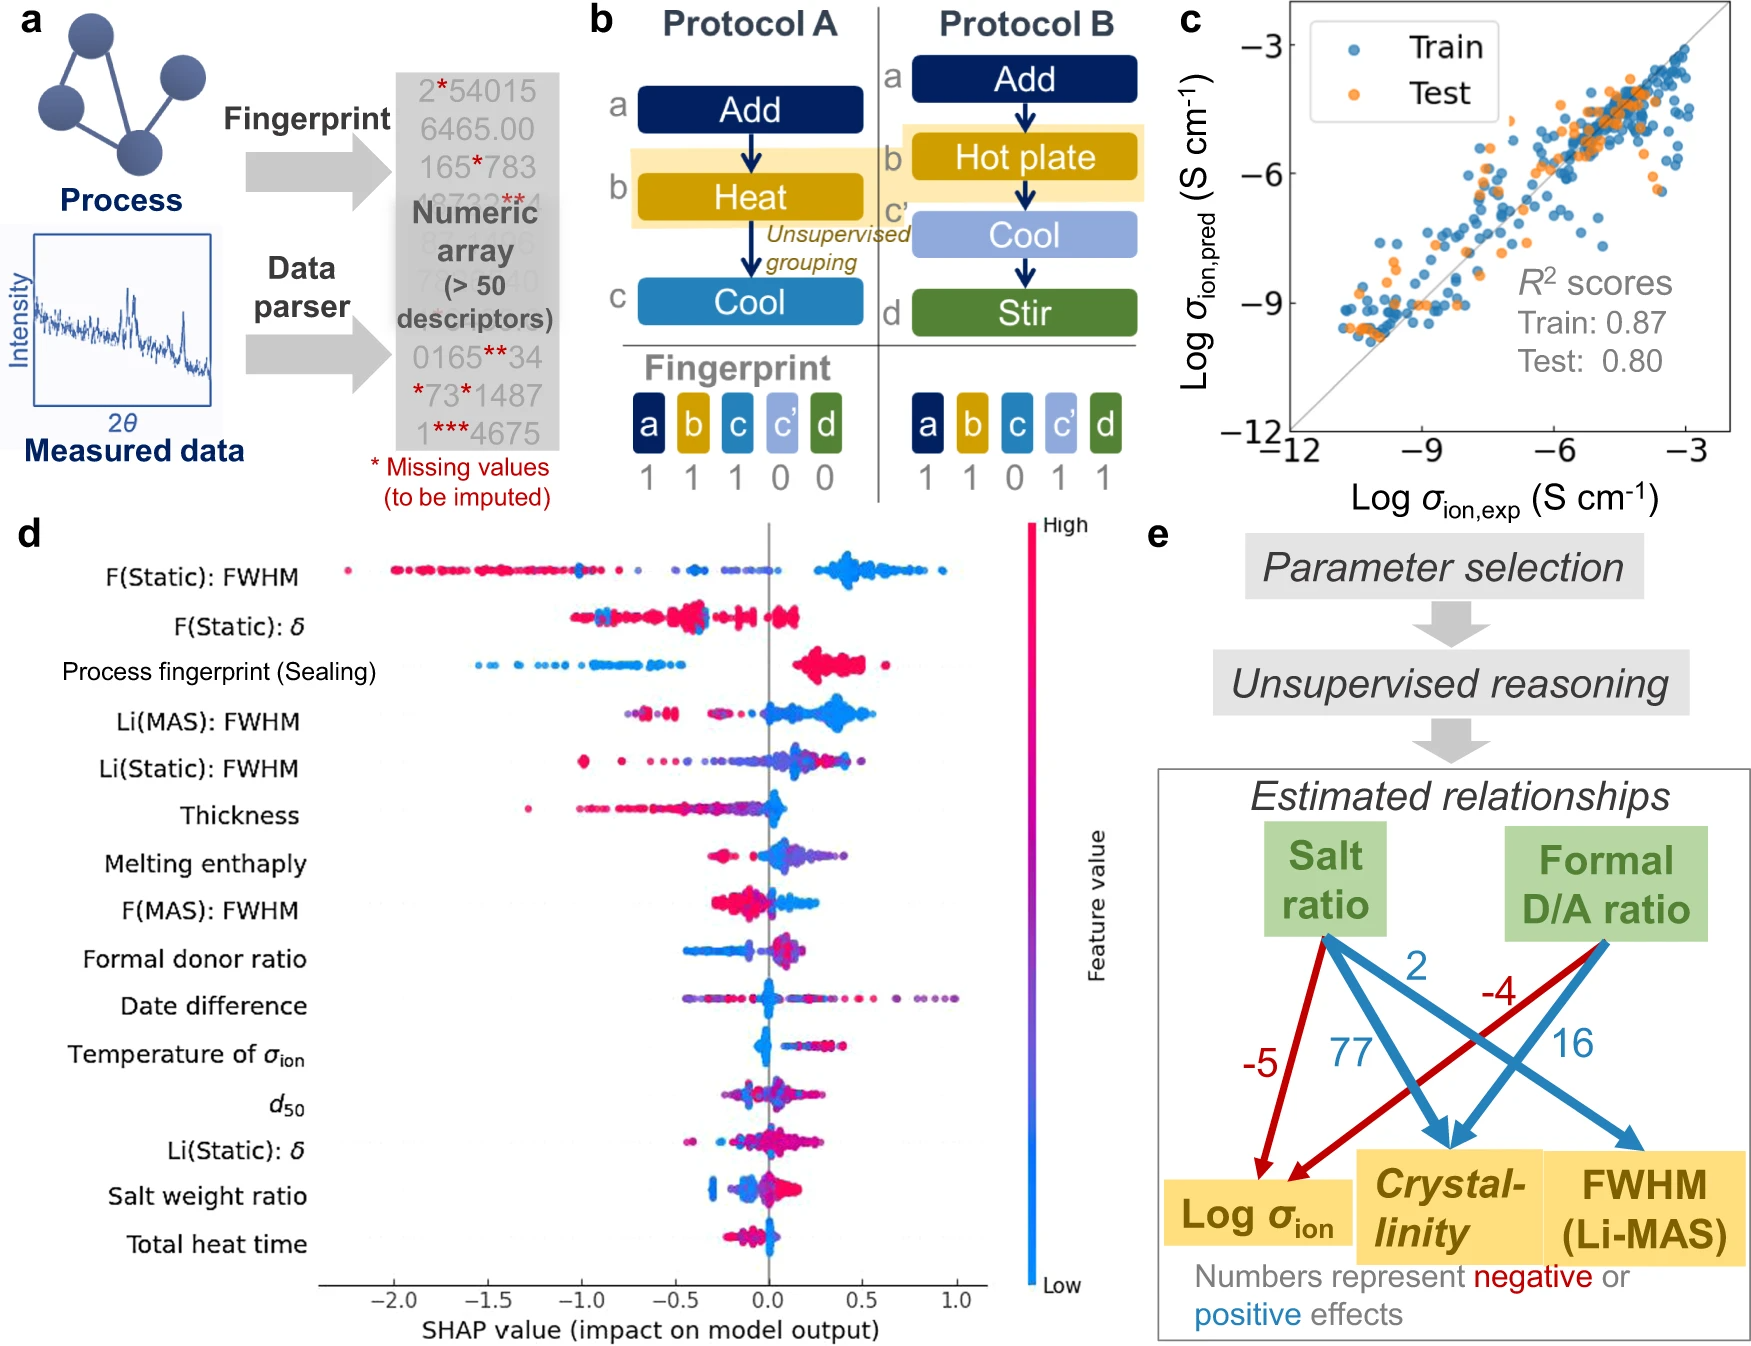 | 1,751 × 1,346 (1.14 MB) | Shawndouglas (talk | contribs) |
You cannot overwrite this file.
File usage
The following page uses this file:


