File:Fig3 Hatakeyama-Sato njpCompMat22 8.png
Original file (1,751 × 1,346 pixels, file size: 1.14 MB, MIME type: image/png)
Summary
| Description |
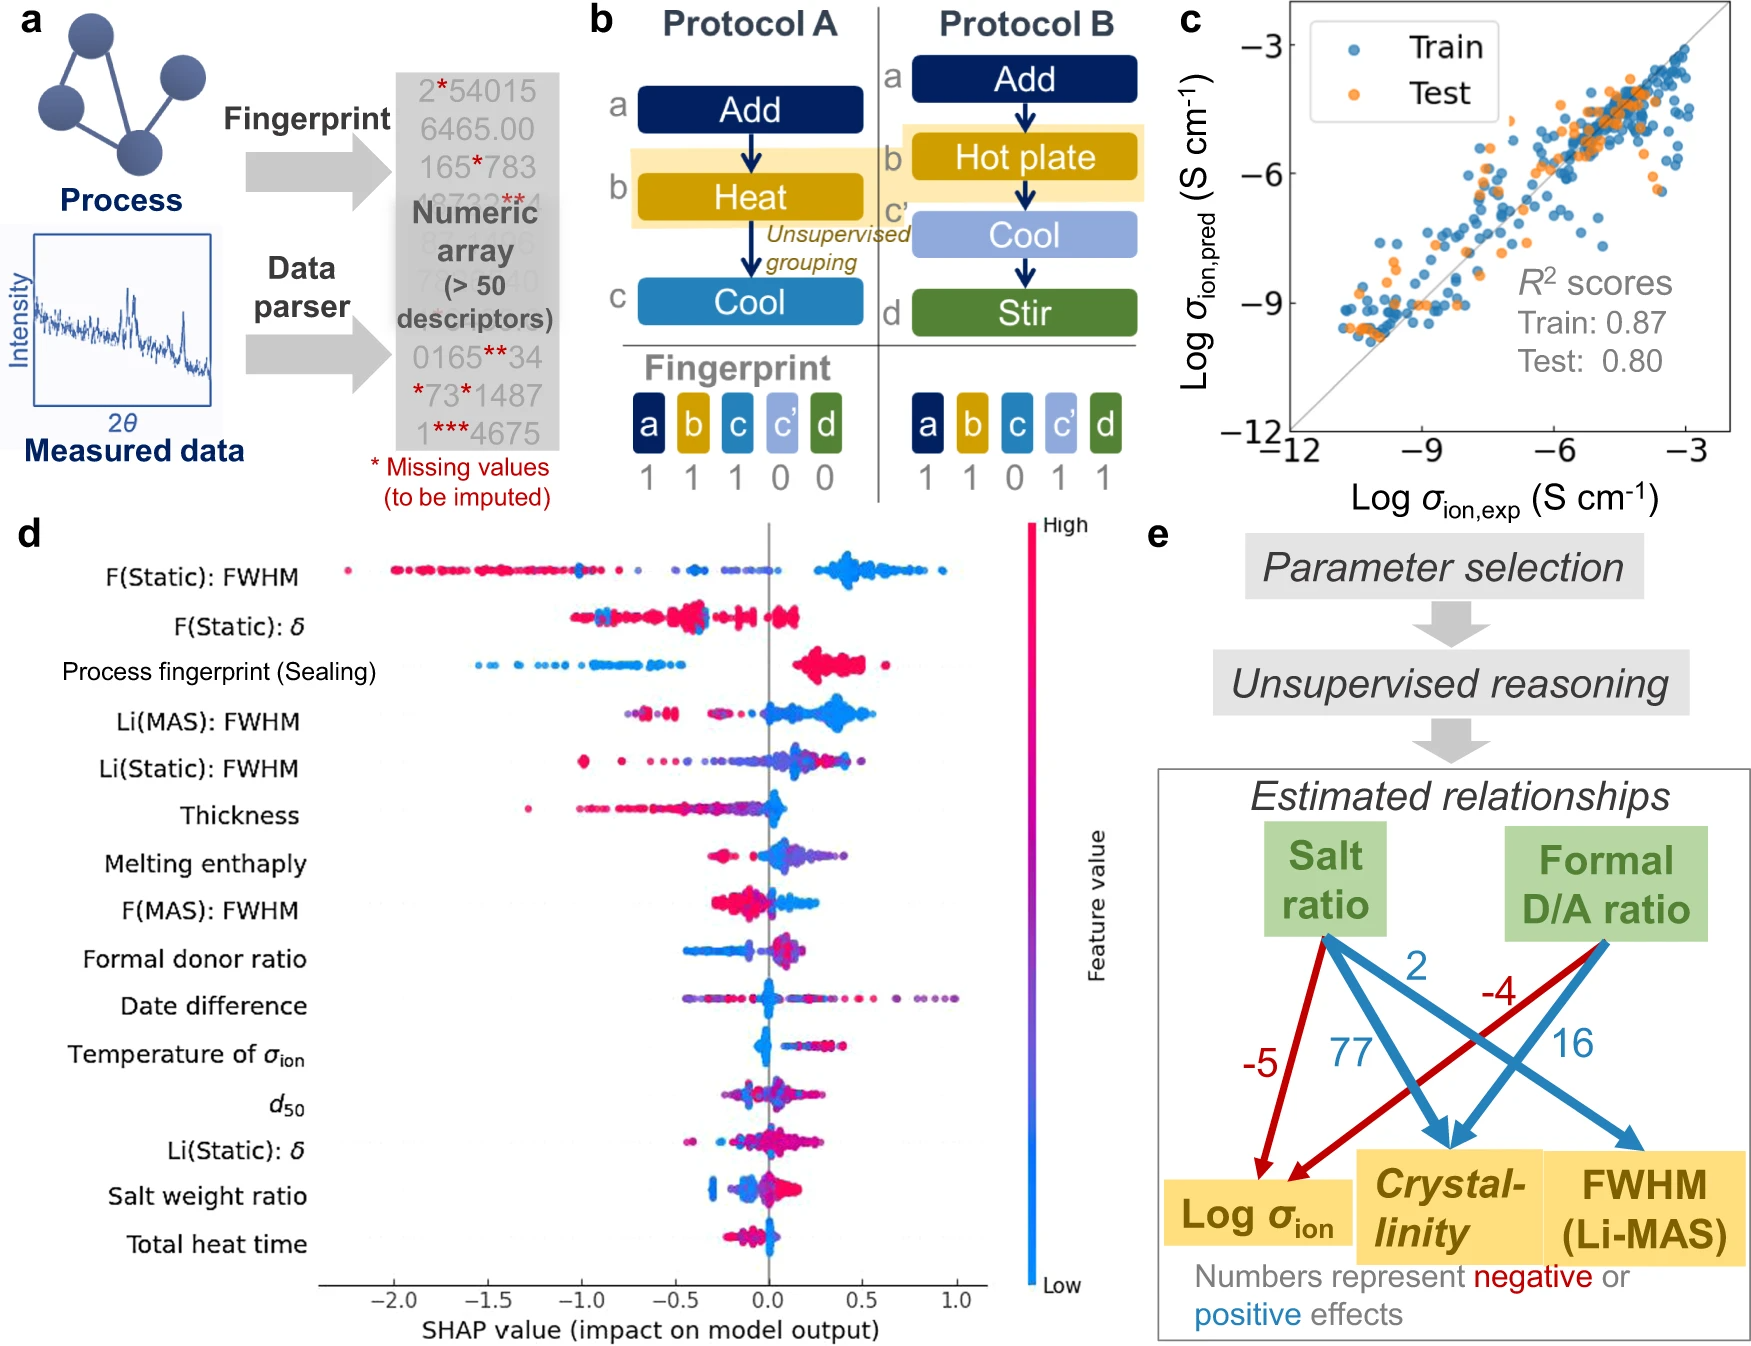
Fig. 3 Automated feature analysis. a Conversion of process and measurement data into a numerical array. A full ML scheme is shown in Supplementary information, Supplementary Fig. 2. b Fingerprint generation from flowcharts. A binary array expresses specific experimental steps (e.g., in the figure, ‘Protocol A’ has steps a, b, c, and not c’ or d: this yields a fingerprint of 11100). ‘Cool’ steps in Protocol A and B are distinguished by c or c’ because only the latter is connected to ‘Stir’. Then, BERT and kNN automatically group similar steps (e.g., ‘Heat’ and ‘Hot plate’ can be categorized in the same group). c Prediction of ionic conductivity (σion) using LightGBM regressor with statistically essential electrolyte parameters extracted by Boruta. d SHAP values during the prediction (explanations of parameters are shown in Supplementary information. Supplementary Table 2). e Causal relations estimated by unsupervised ML. |
|---|---|
| Source |
Hatakeyama-Sato, K.; Umeki, M.; Adachi, H.; Kuwata, N.; Hasegawa, G.; Oyaizu, K. (2022). "Exploration of organic superionic glassy conductors by process and materials informatics with lossless graph database". npj Computational Materials 8: 170. doi:10.1038/s41524-022-00853-0. |
| Date |
2022 |
| Author |
Hatakeyama-Sato, K.; Umeki, M.; Adachi, H.; Kuwata, N.; Hasegawa, G.; Oyaizu, K. |
| Permission (Reusing this file) |
|
| Other versions |
Licensing
|
|
This work is licensed under the Creative Commons Attribution 4.0 License. |
File history
Click on a date/time to view the file as it appeared at that time.
| Date/Time | Thumbnail | Dimensions | User | Comment | |
|---|---|---|---|---|---|
| current | 21:45, 2 November 2022 | | 1,751 × 1,346 (1.14 MB) | Shawndouglas (talk | contribs) |
You cannot overwrite this file.
File usage
The following page uses this file:


