File:Fig4 Chambers JofCannRes23 5.png
Original file (1,416 × 1,063 pixels, file size: 263 KB, MIME type: image/png)
Summary
| Description |
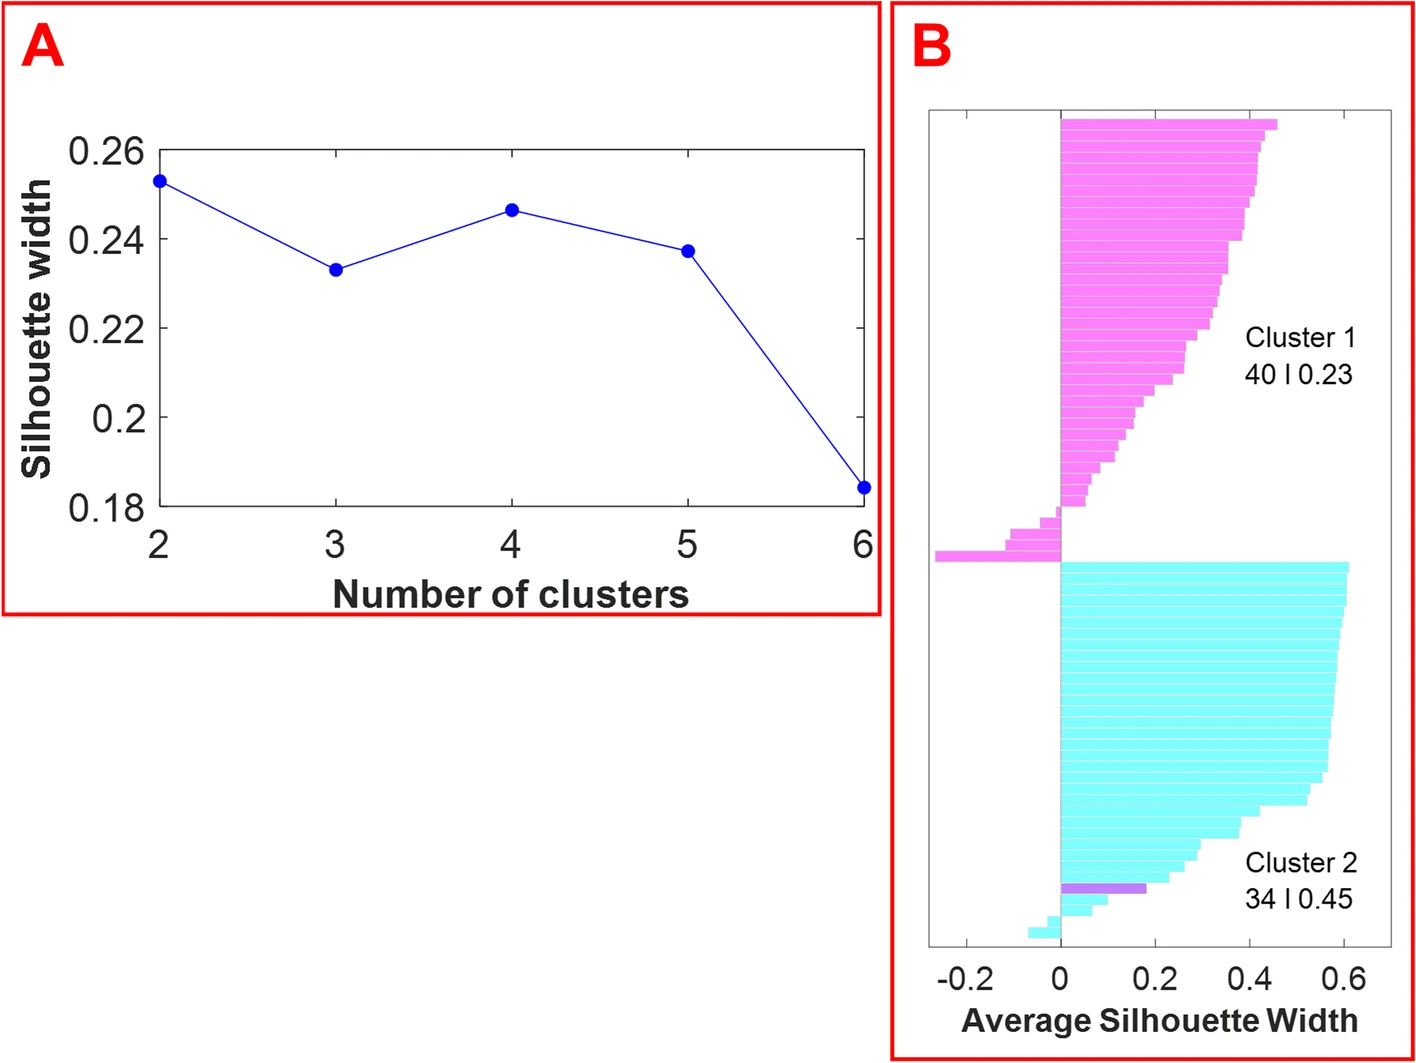
Fig. 4 The average silhouette width over a range of cluster numbers (2–6) reveals that the optimum number of clusters is 2 (panel A). A silhouette plot (i.e., the visualization of the silhouette width for each sample) reveals the results with two clusters (panel B). Cluster 1 contains 40 members and cluster 2 contains 34 members. Hemp samples are shown in magenta, while marijuana samples are shown in cyan. |
|---|---|
| Source |
Chambers, M.I.; Beyramysoltan, S.; Garosi, B.; Musah, R.A. (2023). "Combined ambient ionization mass spectrometric and chemometric approach for the differentiation of hemp and marijuana varieties of Cannabis sativa". Journal of Cannabis Research 5: 5. doi:10.1186/s42238-023-00173-0. |
| Date |
2023 |
| Author |
Chambers, M.I.; Beyramysoltan, S.; Garosi, B.; Musah, R.A. |
| Permission (Reusing this file) |
|
| Other versions |
Licensing
|
|
This work is licensed under the Creative Commons Attribution 4.0 License. |
File history
Click on a date/time to view the file as it appeared at that time.
| Date/Time | Thumbnail | Dimensions | User | Comment | |
|---|---|---|---|---|---|
| current | 22:42, 26 December 2023 | | 1,416 × 1,063 (263 KB) | Shawndouglas (talk | contribs) |
You cannot overwrite this file.


