File:Fig4 Lam BMCBioinformatics2016 17.gif
Fig4_Lam_BMCBioinformatics2016_17.gif (472 × 506 pixels, file size: 69 KB, MIME type: image/gif)
Summary
| Description |
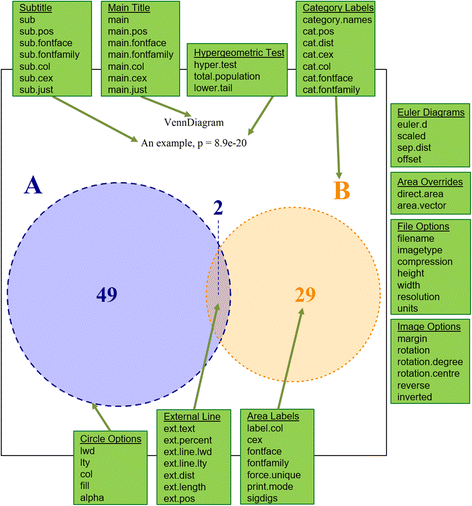
Figure 4. A Venn diagram generated using VennDiagramWeb, annotated to indicate the parameters corresponding to features of the plot. The panels in green highlight the parameters of the tool, showing with arrows what elements of the Venn diagram are directly affected. All green elements are not generated as part of the Venn diagram. |
|---|---|
| Source |
Lam, Felix.; Lalansingh, Christopher, M.; Babaran, Holly E.; Wang, Zhiyuan; Prokepec, Stephenie D.; Fox, Natalie S.; Boutros, Paul C. (2016). "VennDiagramWeb: A web application for the generation of highly customizable Venn and Euler diagrams". BMC Bioinformatics 17: 401. doi:10.1186/s12859-016-1281-5. PMID 27716034. |
| Date |
2016 |
| Author |
Lam, Felix.; Lalansingh, Christopher, M.; Babaran, Holly E.; Wang, Zhiyuan; Prokepec, Stephenie D.; Fox, Natalie S.; Boutros, Paul C. |
| Permission (Reusing this file) |
|
| Other versions |
Licensing
|
|
This work is licensed under the Creative Commons Attribution 4.0 License. |
File history
Click on a date/time to view the file as it appeared at that time.
| Date/Time | Thumbnail | Dimensions | User | Comment | |
|---|---|---|---|---|---|
| current | 12:30, 12 October 2016 |  | 472 × 506 (69 KB) | Shawndouglas (talk | contribs) |
You cannot overwrite this file.
File usage
The following page uses this file:


