File:Fig5 Rubel FInNeuroinformatics2016 10.jpg
Original file (964 × 318 pixels, file size: 187 KB, MIME type: image/jpeg)
Summary
| Description |
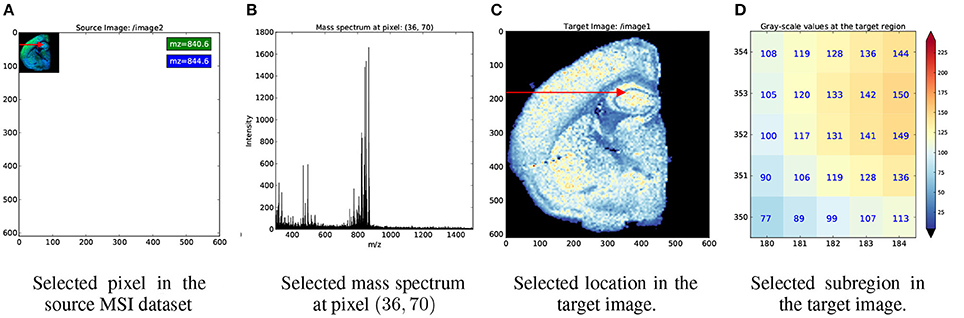
Figure 5. Example showing the application of index map relationships for data selection. (A) First we apply the selection [36, 70] (red arrow) to our source, MSI dataset. (B) As expected, this results in the selection of a single mass spectrum. (C) We next map the same selection to our target dataset. From the red arrow we can see that the selection was mapped correctly to same relative location as in our source, image. (D) The pixel plot illustrates that the mapping resulted, as expected, in the selection of a 5 × 5 sub-image from our target image. In (C,D) we use the color map shown on the right to map gray-scale values in the monochrome image to color. |
|---|---|
| Source |
Rübel, O.; Dougherty, M.; Prabhat; Denes, P.; Conant, D.; Chang, E.F.; Bouchard, K. (2016). "Methods for specifying scientific data standards and modeling relationships with applications to neuroscience". Frontiers in Neuroinformatics 10: 48. doi:10.3389/fninf.2016.00048. PMID 27867355. |
| Date |
2016 |
| Author |
Rübel, O.; Dougherty, M.; Prabhat; Denes, P.; Conant, D.; Chang, E.F.; Bouchard, K. |
| Permission (Reusing this file) |
|
| Other versions |
Licensing
|
|
This work is licensed under the Creative Commons Attribution 4.0 License. |
File history
Click on a date/time to view the file as it appeared at that time.
| Date/Time | Thumbnail | Dimensions | User | Comment | |
|---|---|---|---|---|---|
| current | 21:49, 20 February 2017 | 964 × 318 (187 KB) | Shawndouglas (talk | contribs) |
You cannot overwrite this file.
File usage
The following page uses this file:


