File:Fig6 Zakutayev SciData2018 5.jpg
Original file (926 × 525 pixels, file size: 73 KB, MIME type: image/jpeg)
Summary
| Description |
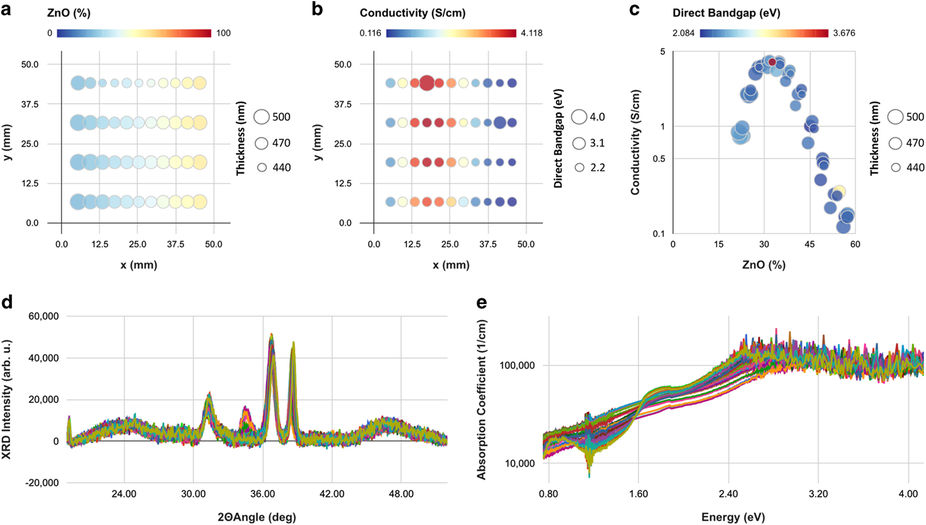
Figure 6. Example property and spectra plots in HTEM DB for one Zn-Ni-Co-O sample library. Panel (a) is a composition (color) and thickness (size), panel (b) is conductivity (color) and its direct bandgap (size), both as a function of x and y position on the sample library. Panel (c) is the summary analysis plot of logarithm of conductivity vs composition, with direct band gap as a color scale, and thickness as point size. Panels (d) and (e) are the underlying x-ray diffraction patterns, and the optical absorption spectra, respectively. |
|---|---|
| Source |
Zakutayev, A.; Wunder, N.; Schwarting, M.; Perkins, J.D.; White, R.; Munch, K.; Tumas, W.; Phillips, C. (2018). "An open experimental database for exploring inorganic materials". Scientific Data 5: 180053. doi:10.1038/sdata.2018.53. |
| Date |
2018 |
| Author |
Zakutayev, A.; Wunder, N.; Schwarting, M.; Perkins, J.D.; White, R.; Munch, K.; Tumas, W.; Phillips, C. |
| Permission (Reusing this file) |
|
| Other versions |
Licensing
|
|
This work is licensed under the Creative Commons Attribution 4.0 License. |
File history
Click on a date/time to view the file as it appeared at that time.
| Date/Time | Thumbnail | Dimensions | User | Comment | |
|---|---|---|---|---|---|
| current | 22:55, 9 April 2018 | | 926 × 525 (73 KB) | Shawndouglas (talk | contribs) |
You cannot overwrite this file.
File usage
The following page uses this file:


