Difference between revisions of "File:Fig8 Rubel FInNeuroinformatics2016 10.jpg"
Shawndouglas (talk | contribs) |
Shawndouglas (talk | contribs) (Added summary.) |
||
| Line 1: | Line 1: | ||
==Summary== | |||
{{Information | |||
|Description='''Figure 8.''' Visualization of the response of all electrodes in the ECoG grid '''(A)''' and the polytrode '''(B)''' to tone stimuli at a frequency of 0.5 to 32 KHz and an attenuation of 0 to −70''dB''. The polytrode was inserted at the intersection of electrodes 12, 13, 14, and 15 in the μECoG grid (demarcated with red bar). Each plot represents a single electrode, while the index of the electrode as defined by the layout of the recording device is indicated in the bottom right of each plot. Each bin in a plot represents the mean of the z-scored response in the 25–50 Hz frequency band after each onset of a tone stimulus of the corresponding amplitude and frequency. Each stimulus is presented 20 times for 300''ms'' each throughout the experiment. | |||
|Source={{cite journal |title=Methods for specifying scientific data standards and modeling relationships with applications to neuroscience |journal=Frontiers in Neuroinformatics |author=Rübel, O.; Dougherty, M.; Prabhat; Denes, P.; Conant, D.; Chang, E.F.; Bouchard, K. |volume=10 |pages=48 |year=2016 |doi=10.3389/fninf.2016.00048 |pmid=27867355}} | |||
|Author=Rübel, O.; Dougherty, M.; Prabhat; Denes, P.; Conant, D.; Chang, E.F.; Bouchard, K. | |||
|Date=2016 | |||
|Permission=[http://creativecommons.org/licenses/by/4.0/ Creative Commons Attribution 4.0 International] | |||
}} | |||
== Licensing == | == Licensing == | ||
{{cc-by-4.0}} | {{cc-by-4.0}} | ||
Latest revision as of 22:23, 20 February 2017
Summary
| Description |
Figure 8. Visualization of the response of all electrodes in the ECoG grid (A) and the polytrode (B) to tone stimuli at a frequency of 0.5 to 32 KHz and an attenuation of 0 to −70dB. The polytrode was inserted at the intersection of electrodes 12, 13, 14, and 15 in the μECoG grid (demarcated with red bar). Each plot represents a single electrode, while the index of the electrode as defined by the layout of the recording device is indicated in the bottom right of each plot. Each bin in a plot represents the mean of the z-scored response in the 25–50 Hz frequency band after each onset of a tone stimulus of the corresponding amplitude and frequency. Each stimulus is presented 20 times for 300ms each throughout the experiment. |
|---|---|
| Source |
Rübel, O.; Dougherty, M.; Prabhat; Denes, P.; Conant, D.; Chang, E.F.; Bouchard, K. (2016). "Methods for specifying scientific data standards and modeling relationships with applications to neuroscience". Frontiers in Neuroinformatics 10: 48. doi:10.3389/fninf.2016.00048. PMID 27867355. |
| Date |
2016 |
| Author |
Rübel, O.; Dougherty, M.; Prabhat; Denes, P.; Conant, D.; Chang, E.F.; Bouchard, K. |
| Permission (Reusing this file) |
|
| Other versions |
Licensing
|
|
This work is licensed under the Creative Commons Attribution 4.0 License. |
File history
Click on a date/time to view the file as it appeared at that time.
| Date/Time | Thumbnail | Dimensions | User | Comment | |
|---|---|---|---|---|---|
| current | 22:20, 20 February 2017 | 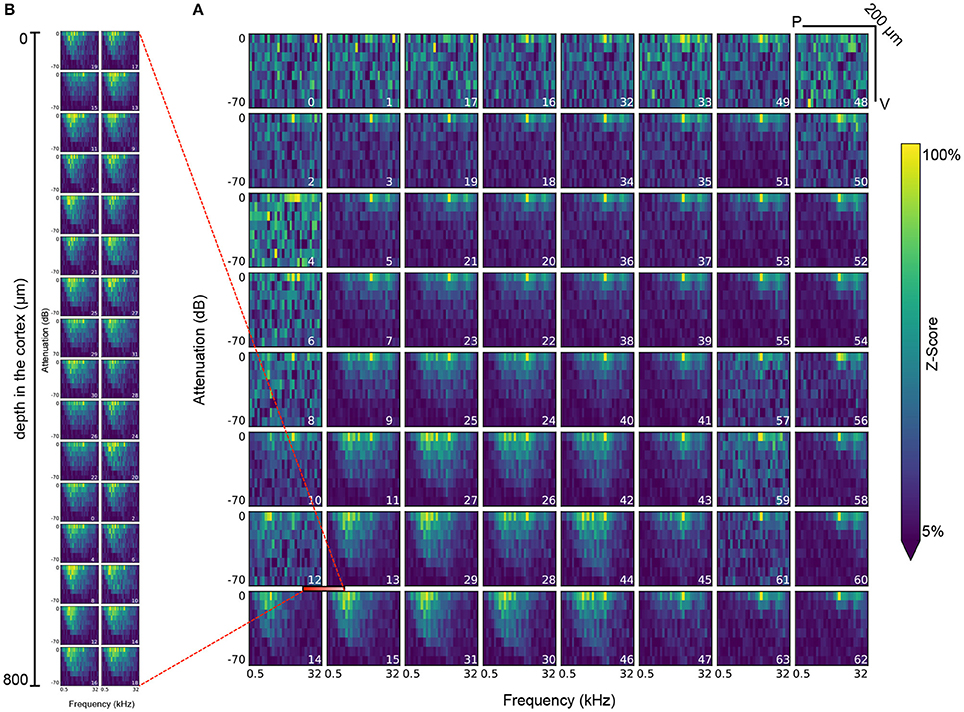 | 964 × 712 (680 KB) | Shawndouglas (talk | contribs) |
You cannot overwrite this file.
File usage
The following page uses this file:


