Difference between revisions of "Template:Article of the week"
Shawndouglas (talk | contribs) (Updated article of the week text.) |
Shawndouglas (talk | contribs) (Updated article of the week text) |
||
| (296 intermediate revisions by the same user not shown) | |||
| Line 1: | Line 1: | ||
<div style="float: left; margin: 0.5em 0.9em 0.4em 0em;">[[File: | <div style="float: left; margin: 0.5em 0.9em 0.4em 0em;">[[File:Fig1 Karaattuthazhathu NatJLabMed23 12-2.png|260px]]</div> | ||
'''"[[Journal: | '''"[[Journal:Sigma metrics as a valuable tool for effective analytical performance and quality control planning in the clinical laboratory: A retrospective study|Sigma metrics as a valuable tool for effective analytical performance and quality control planning in the clinical laboratory: A retrospective study]]"''' | ||
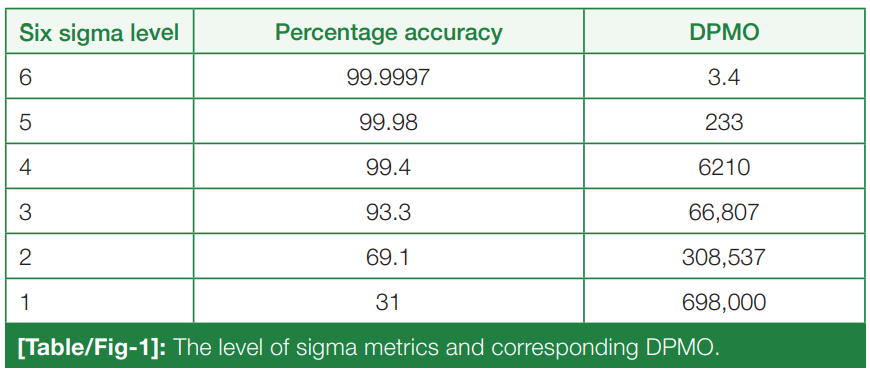
For the release of precise and accurate reports of [[Medical test|routine tests]], its necessary to follow a proper [[quality management system]] (QMS) in the [[clinical laboratory]]. As one of the most popular QMS tools for process improvement, Six Sigma techniques and tools have been accepted widely in the [[laboratory]] testing process. Six Sigma gives an objective assessment of analytical methods and instrumentation, measuring the outcome of a process on a scale of 0 to 6. Poor outcomes are measured in terms of defects per million opportunities (DPMO). To do the performance assessment of each clinical laboratory [[analyte]] by Six Sigma analysis and to plan and chart out a better, customized [[quality control]] (QC) plan for each analyte, according to its own sigma value ... ('''[[Journal:Sigma metrics as a valuable tool for effective analytical performance and quality control planning in the clinical laboratory: A retrospective study|Full article...]]''')<br /> | |||
''Recently featured'': | |||
{{flowlist | | |||
<br /> | * [[Journal:Why do we need food systems informatics? Introduction to this special collection on smart and connected regional food systems|Why do we need food systems informatics? Introduction to this special collection on smart and connected regional food systems]] | ||
''Recently featured'': | * [[Journal:Data management challenges for artificial intelligence in plant and agricultural research|Data management challenges for artificial intelligence in plant and agricultural research]] | ||
* [[Journal:A blockchain-driven IoT-based food quality traceability system for dairy products using a deep learning model|A blockchain-driven IoT-based food quality traceability system for dairy products using a deep learning model]] | |||
}} | |||
Latest revision as of 16:52, 29 April 2024
For the release of precise and accurate reports of routine tests, its necessary to follow a proper quality management system (QMS) in the clinical laboratory. As one of the most popular QMS tools for process improvement, Six Sigma techniques and tools have been accepted widely in the laboratory testing process. Six Sigma gives an objective assessment of analytical methods and instrumentation, measuring the outcome of a process on a scale of 0 to 6. Poor outcomes are measured in terms of defects per million opportunities (DPMO). To do the performance assessment of each clinical laboratory analyte by Six Sigma analysis and to plan and chart out a better, customized quality control (QC) plan for each analyte, according to its own sigma value ... (Full article...)
Recently featured:
- Why do we need food systems informatics? Introduction to this special collection on smart and connected regional food systems
- Data management challenges for artificial intelligence in plant and agricultural research
- A blockchain-driven IoT-based food quality traceability system for dairy products using a deep learning model


