Template:Article of the week
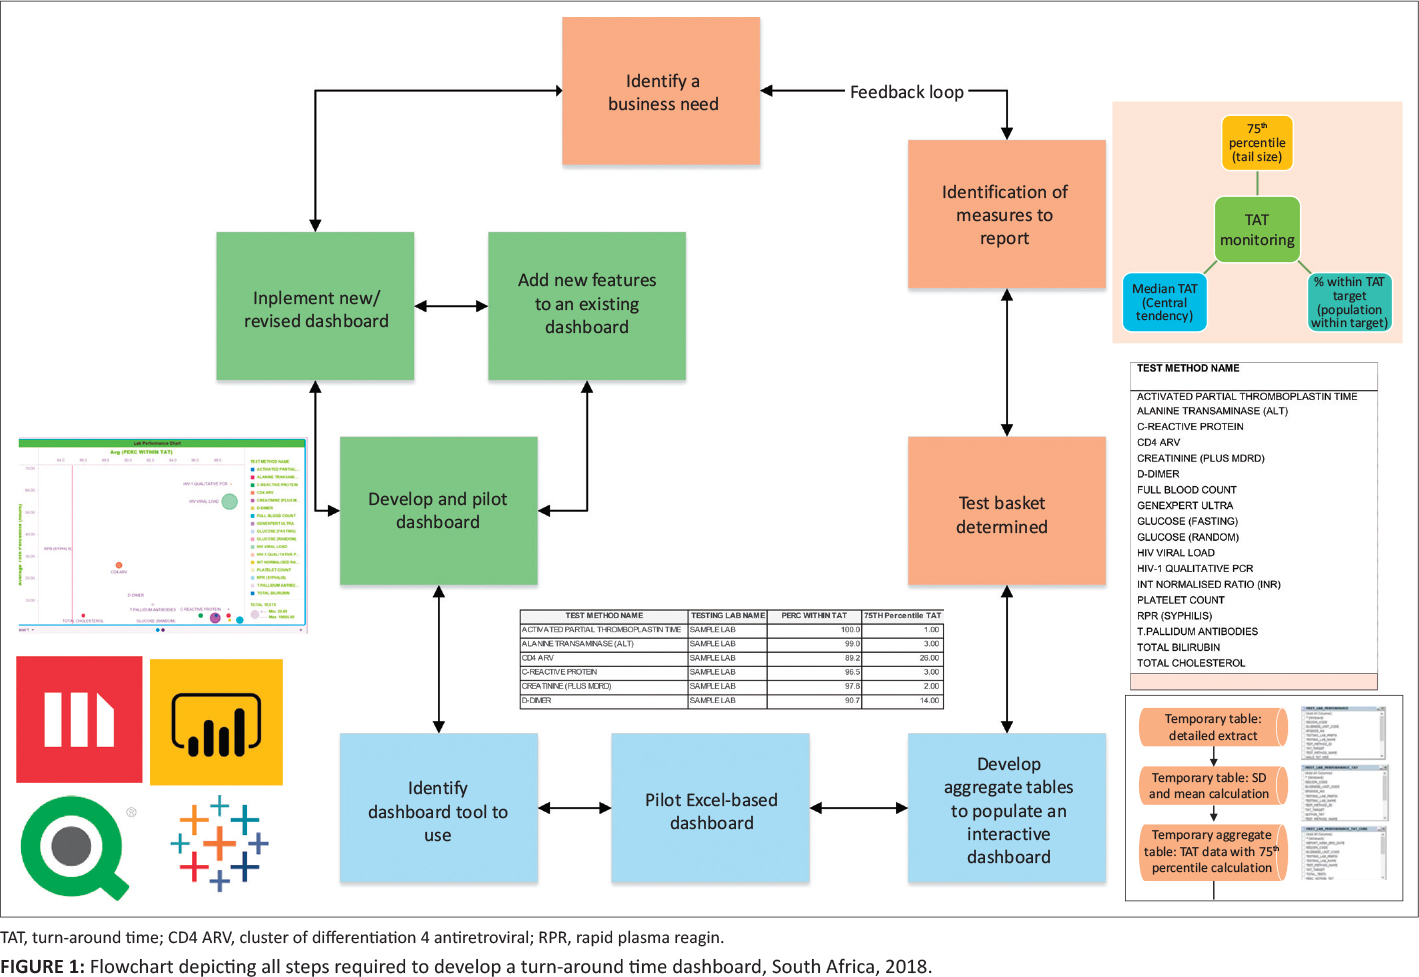
Mean turnaround time (TAT) reporting for testing laboratories in a national network is typically static and not immediately available for meaningful corrective action and does not allow for test-by-test or site-by-site interrogation of individual laboratory performance. The aim of this study was to develop an easy-to-use, visual dashboard to report interactive graphical TAT data to provide a weekly snapshot of TAT efficiency. An interactive dashboard was developed by staff from the National Priority Programme and Central Data Warehouse of the National Health Laboratory Service in Johannesburg, South Africa, during 2018. Steps required to develop the dashboard were summarized in a flowchart. To illustrate the dashboard, one week of data from a busy laboratory for a specific set of tests was analyzed using annual performance plan TAT cutoffs. Data were extracted and prepared to deliver an aggregate extract, with statistical measures provided, including test volumes, global percentage of tests that were within TAT cutoffs, and percentile statistics. (Full article...)
Recently featured:
- Advanced engineering informatics: Philosophical and methodological foundations with examples from civil and construction engineering
- Explainability for artificial intelligence in healthcare: A multidisciplinary perspective
- Secure record linkage of large health data sets: Evaluation of a hybrid cloud model


