File:Fig2 Cervin JofPathInfo2016 7.jpg
Original file (808 × 391 pixels, file size: 121 KB, MIME type: image/jpeg)
Summary
| Description |
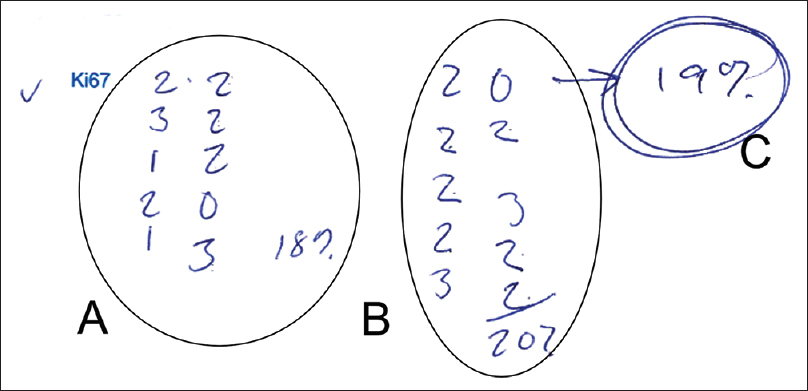
Figure 2. A pathologist's scribbles when calculating the Ki - 67 index. A and B represents two close by areas with a total of 100 cells each. Each of the numbers in A and B represents the number of positive cells in one - tenth of the 100 cells. The numbers are then summed and translated to percent. C represents the mean of the two calculated areas. |
|---|---|
| Source |
Cervin, I.; Molin, J.; Lundstrom, C. (2016). "Improving the creation and reporting of structured findings during digital pathology review". Journal of Pathology Informatics 7: 32. doi:10.4103/2153-3539.186917. |
| Date |
2016 |
| Author |
Cervin, I.; Molin, J.; Lundstrom, C. |
| Permission (Reusing this file) |
Creative Commons Attribution-NonCommercial-ShareAlike 3.0 Unported |
| Other versions |
Licensing
|
|
This work is licensed under the Creative Commons Attribution-NonCommercial-ShareAlike 3.0 Unported License. |
File history
Click on a date/time to view the file as it appeared at that time.
| Date/Time | Thumbnail | Dimensions | User | Comment | |
|---|---|---|---|---|---|
| current | 19:55, 15 August 2016 | | 808 × 391 (121 KB) | Shawndouglas (talk | contribs) |
You cannot overwrite this file.
File usage
The following page uses this file:


