File:Fig5 Panahiazar JofBiomedInformatics2017 72-8.jpg
Original file (2,760 × 846 pixels, file size: 386 KB, MIME type: image/jpeg)
Summary
| Description |
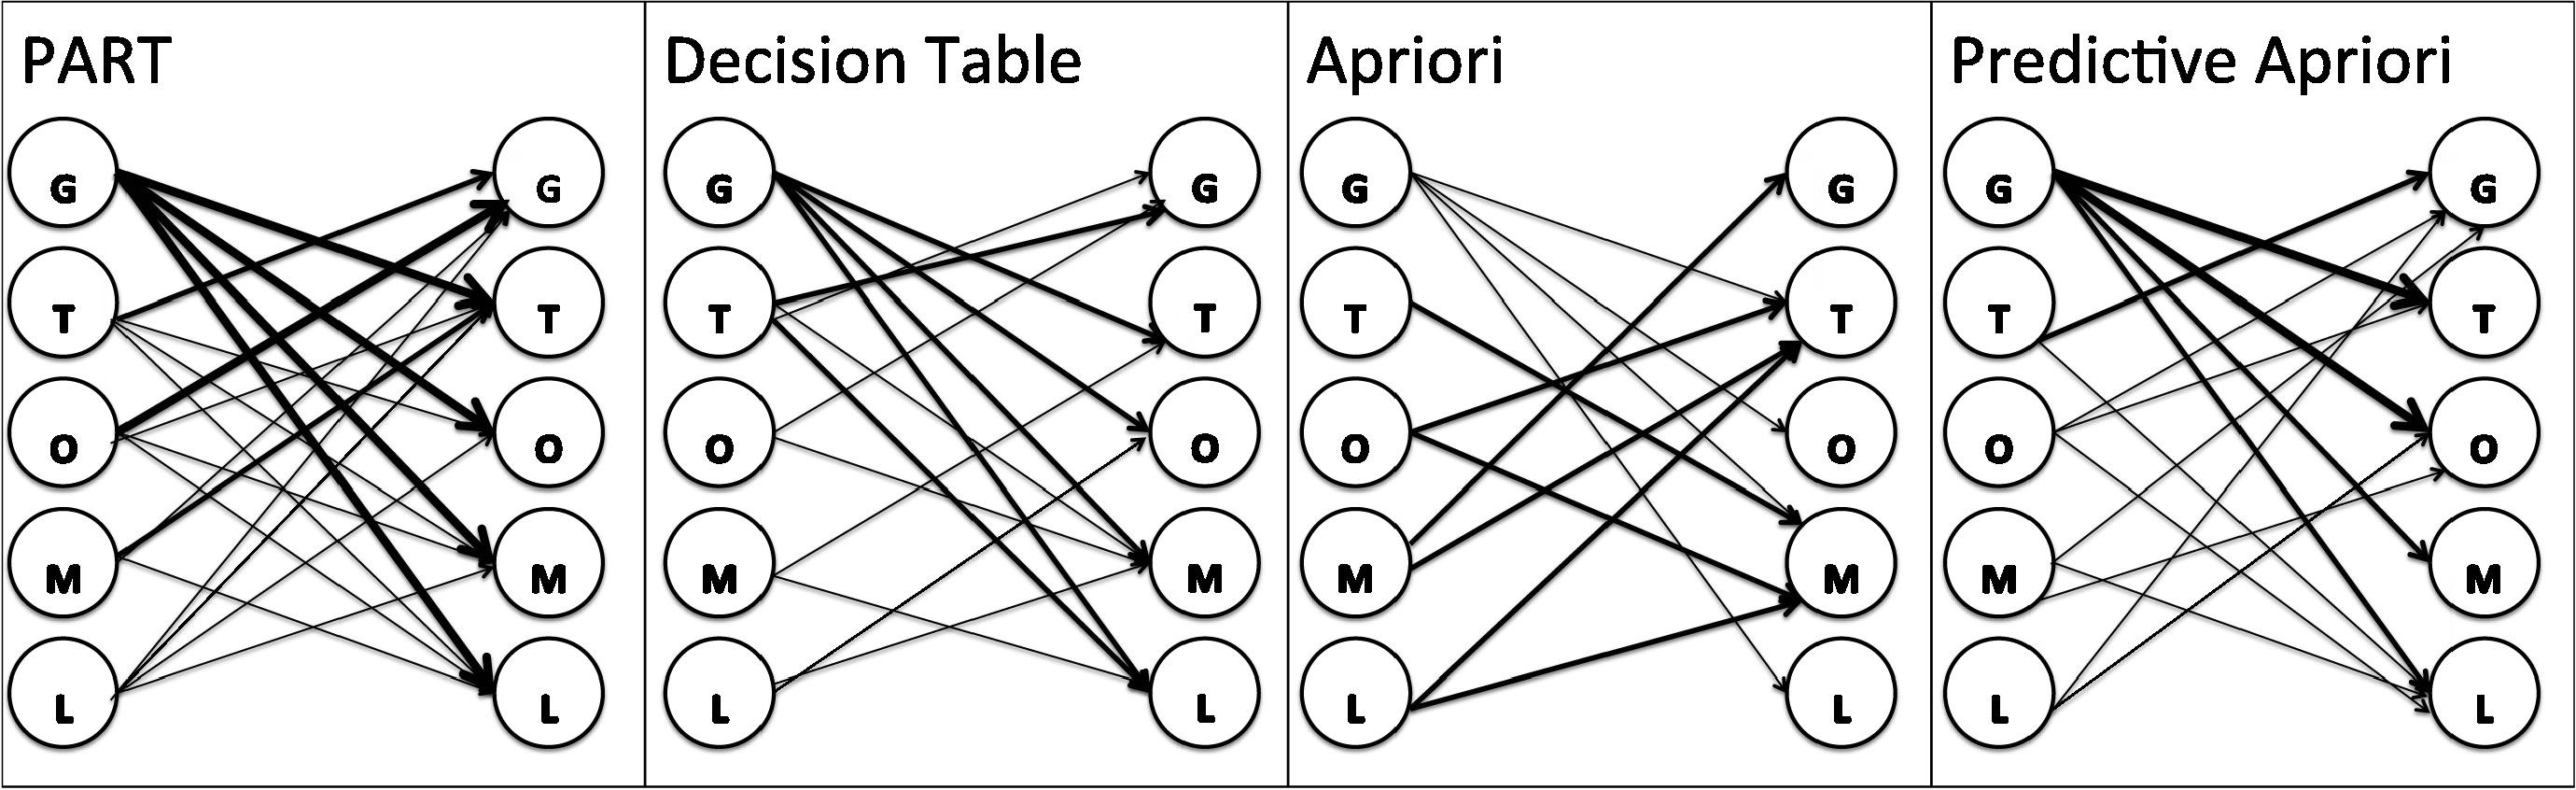
Figure 5. A network diagram illustrating associations between all elements (GPL for platform, Type, Organism, and Molecule) in rules generated by all algorithms. This association shows which element is more predictable based on other elements. It also reveals the power of each element to predict other elements. Thick lines indicate associations of bigger than 0.5 (strong association), medium lines indicate associations between 0.05 and 0.5. Associations of strength less than 0.05 are thin lines (weak association). |
|---|---|
| Source |
Panahiazar, M.; Dumontier, M.; Gevaert, O. (2017). "Predicting biomedical metadata in CEDAR: A study of Gene Expression Omnibus (GEO)". Journal of Biomedical Informatics 72: 8. doi:10.1016/j.jbi.2017.06.017. |
| Date |
2017 |
| Author |
Panahiazar, M.; Dumontier, M.; Gevaert, O. |
| Permission (Reusing this file) |
Creative Commons Attribution-NonCommercial-NoDerivatives 4.0 International |
| Other versions |
Licensing
|
|
This work is licensed under the Creative Commons Attribution-NonCommercial-NoDerivatives 4.0 International License. |
File history
Click on a date/time to view the file as it appeared at that time.
| Date/Time | Thumbnail | Dimensions | User | Comment | |
|---|---|---|---|---|---|
| current | 15:39, 23 August 2017 | 2,760 × 846 (386 KB) | Shawndouglas (talk | contribs) |
You cannot overwrite this file.
File usage
The following page uses this file:


