File:Fig7 Panse JofIntegBioinfo2022 19-4.jpg
From LIMSWiki
Jump to navigationJump to search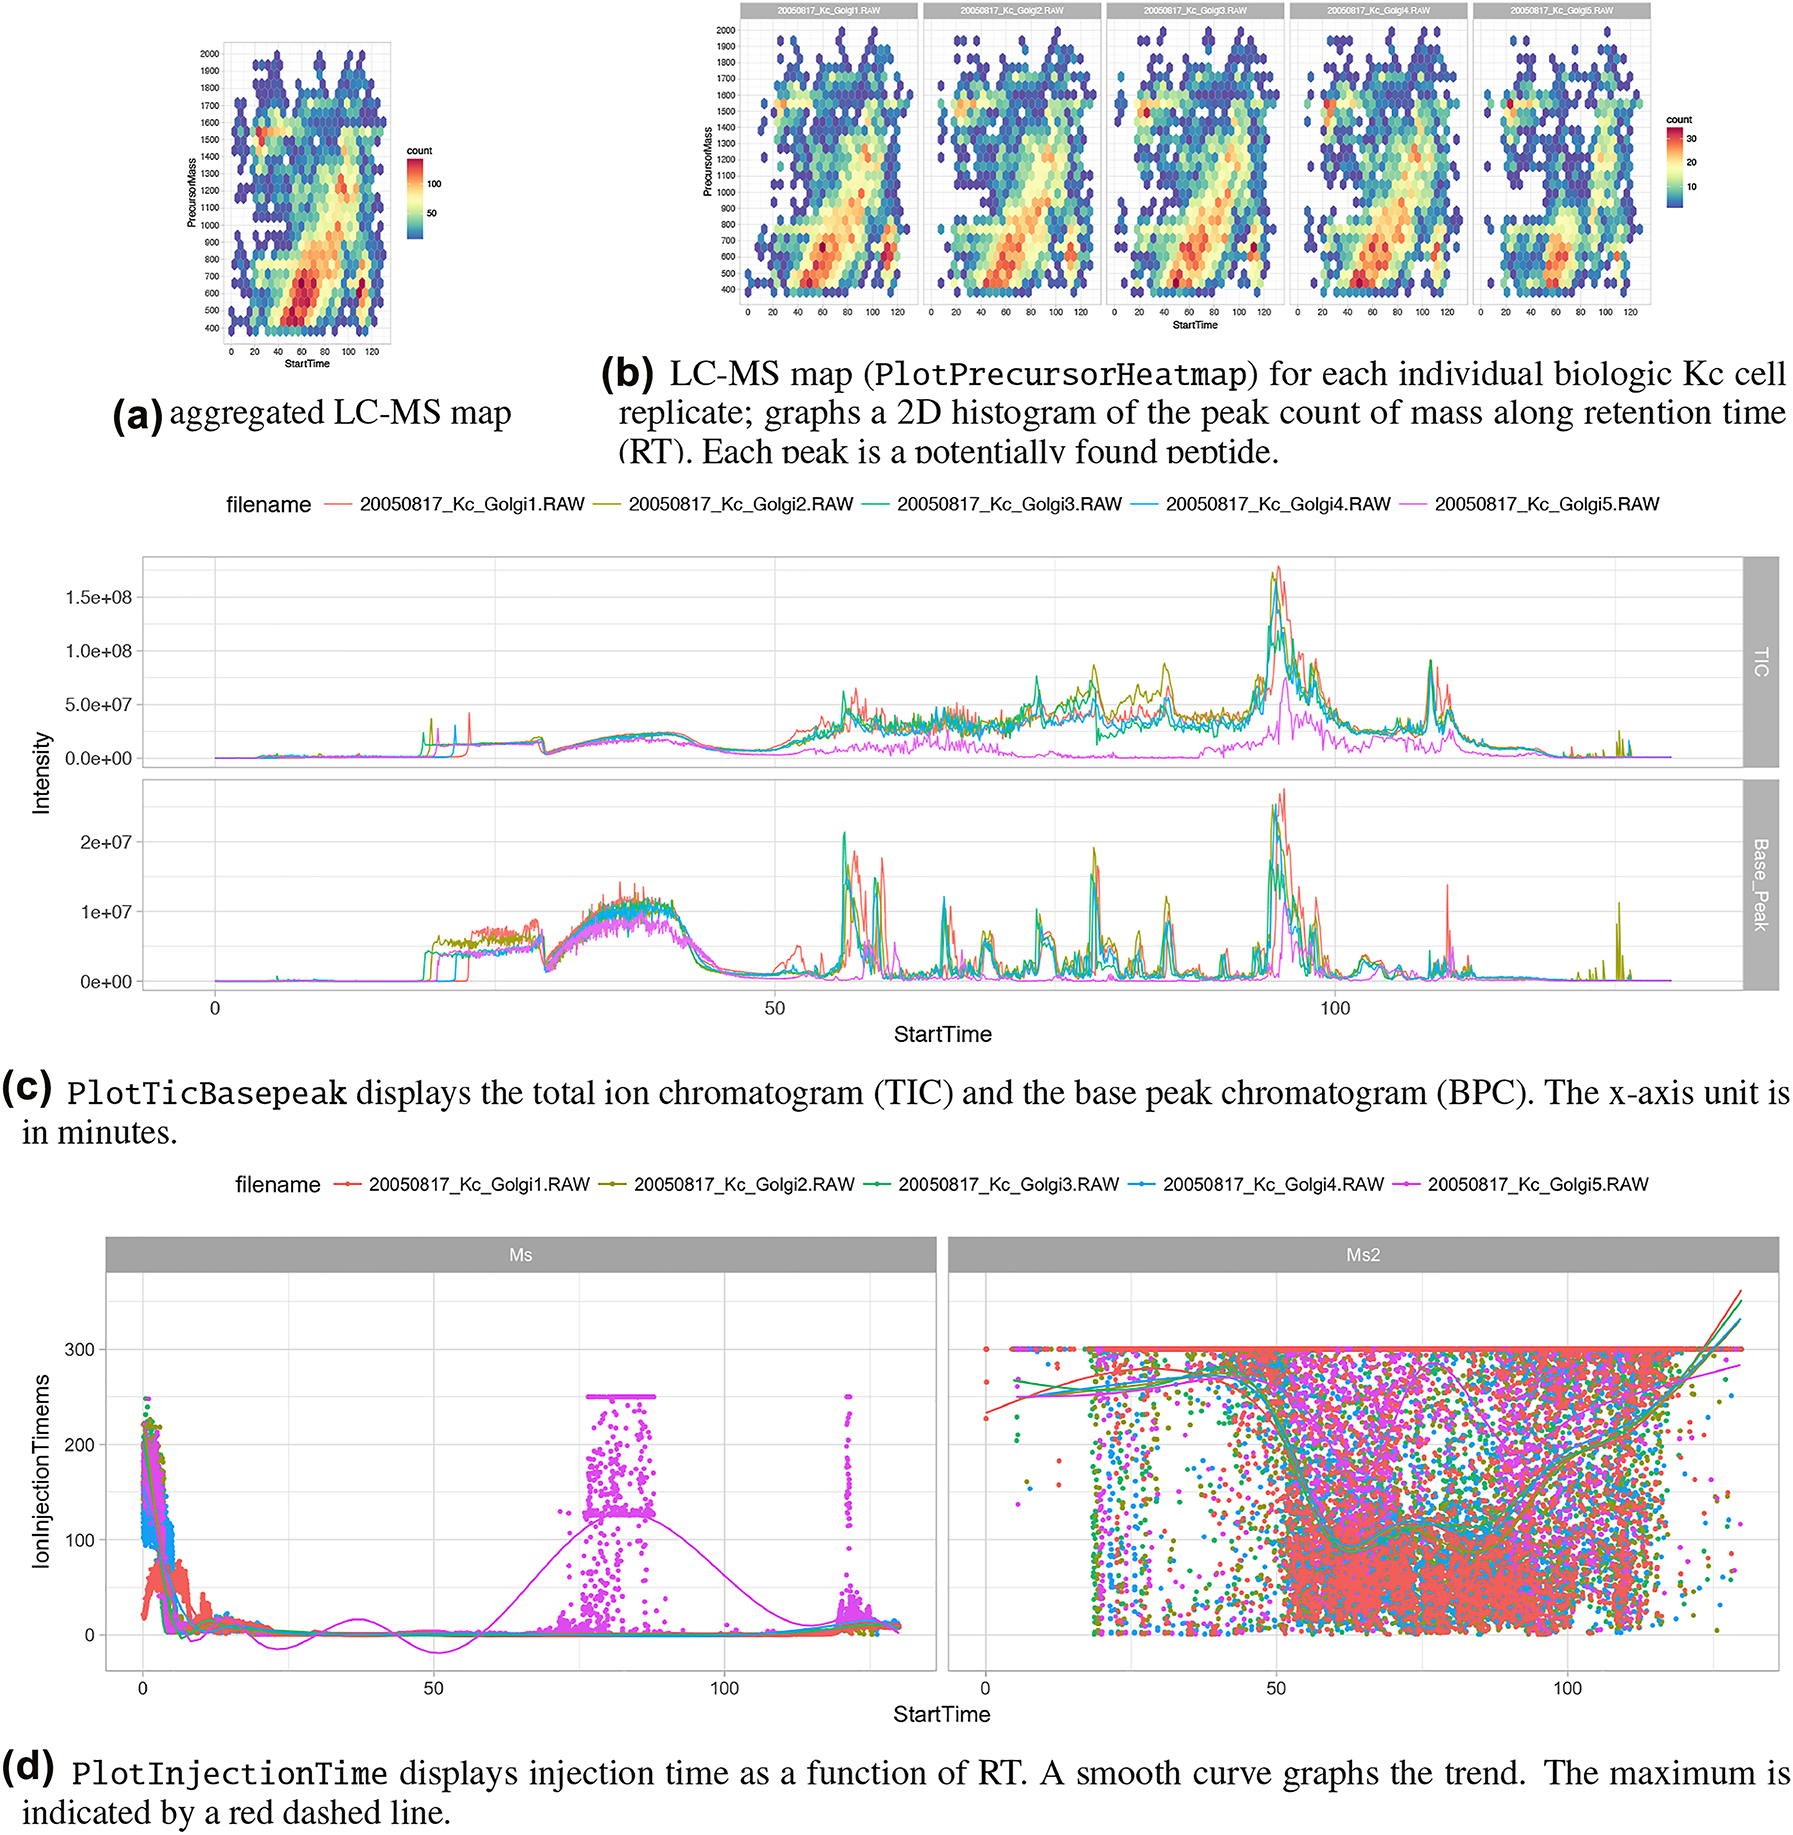
Size of this preview: 586 × 600 pixels. Other resolution: 1,793 × 1,835 pixels.
Original file (1,793 × 1,835 pixels, file size: 1.73 MB, MIME type: image/jpeg)
Summary
| Description |
Figure 7. Example 2 of visual exploration using the R command line. |
|---|---|
| Source |
Panse, C.; Trachsel, C.; Türker, C. (2022). "Bridging data management platforms and visualization tools to enable ad-hoc and smart analytics in life sciences". Journal of Integrative Bioinformatics 19 (4): 20220031. doi:10.1515/jib-2022-0031. |
| Date |
2022 |
| Author |
Panse, C.; Trachsel, C.; Türker, C. |
| Permission (Reusing this file) |
|
| Other versions |
Licensing
|
|
This work is licensed under the Creative Commons Attribution 4.0 License. |
File history
Click on a date/time to view the file as it appeared at that time.
| Date/Time | Thumbnail | Dimensions | User | Comment | |
|---|---|---|---|---|---|
| current | 19:34, 13 March 2023 | | 1,793 × 1,835 (1.73 MB) | Shawndouglas (talk | contribs) |
You cannot overwrite this file.
File usage
The following page uses this file:


