File:Fig3 Udesky EnviroHealth2019 18.png
Original file (564 × 702 pixels, file size: 54 KB, MIME type: image/png)
Summary
| Description |
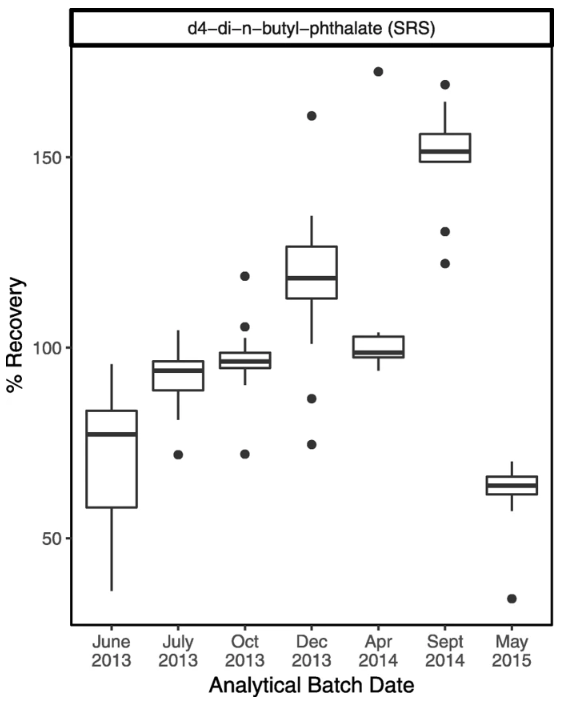
Figure 3. In this example from our data, recoveries of surrogate d4-di-n-butyl-phthalate from air samples showed notable upward and downward trends over time, despite largely staying within the 50–150% acceptable bounds. Here we were examining surrogate recoveries in batches of samples from different studies analyzed at the same laboratory. The last two batches (Sept 2014 and May 2015) were from the same study but collected approximately a year apart per the study design. |
|---|---|
| Source |
Udesky, J.O.; Dodson, R.E.; Perovich, L.J.; Rudel, R.A. (2019). "Wrangling environmental exposure data: Guidance for getting the best information from your laboratory measurements". Environmental Health 18: 99. doi:10.1186/s12940-019-0537-8. |
| Date |
2019 |
| Author |
Udesky, J.O.; Dodson, R.E.; Perovich, L.J.; Rudel, R.A. |
| Permission (Reusing this file) |
|
| Other versions |
Licensing
|
|
This work is licensed under the Creative Commons Attribution 4.0 License. |
File history
Click on a date/time to view the file as it appeared at that time.
| Date/Time | Thumbnail | Dimensions | User | Comment | |
|---|---|---|---|---|---|
| current | 23:51, 13 April 2020 | | 564 × 702 (54 KB) | Shawndouglas (talk | contribs) |
You cannot overwrite this file.
File usage
The following page uses this file:


