File:Fig4 Udesky EnviroHealth2019 18.png
Original file (543 × 641 pixels, file size: 66 KB, MIME type: image/png)
Summary
| Description |
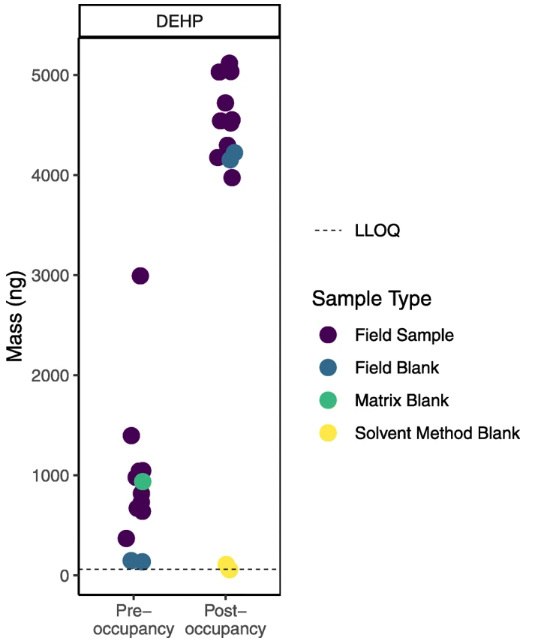
Figure 4. Phthalate DEHP measured in air in college dorm rooms before and after occupancy (data not yet published). Levels in our samples (purple dots) were higher post- compared to pre-occupancy, but this plot revealed that levels in field blanks (blue dots) were also higher post- compared to pre-occupancy and within the range of field samples. We also saw a matrix blank (green dot) well within the range of the field samples in the pre-occupancy batch. These data suggest DEHP contamination in both batches; for the post-occupancy batch, we hypothesized this might have come from the plastic bags in which the samplers were shipped. We will not report results for this chemical from this study, given the evidence of contamination. LLOQ = Lower Limit of Quantitation. |
|---|---|
| Source |
Udesky, J.O.; Dodson, R.E.; Perovich, L.J.; Rudel, R.A. (2019). "Wrangling environmental exposure data: Guidance for getting the best information from your laboratory measurements". Environmental Health 18: 99. doi:10.1186/s12940-019-0537-8. |
| Date |
2019 |
| Author |
Udesky, J.O.; Dodson, R.E.; Perovich, L.J.; Rudel, R.A. |
| Permission (Reusing this file) |
|
| Other versions |
Licensing
|
|
This work is licensed under the Creative Commons Attribution 4.0 License. |
File history
Click on a date/time to view the file as it appeared at that time.
| Date/Time | Thumbnail | Dimensions | User | Comment | |
|---|---|---|---|---|---|
| current | 00:40, 14 April 2020 | | 543 × 641 (66 KB) | Shawndouglas (talk | contribs) |
You cannot overwrite this file.
File usage
The following page uses this file:


