 |
This article should be considered a work in progress and incomplete. Consider this article incomplete until this notice is removed. |
Abstract
Hemp products are readily available and are aggressively marketed for their health and medicinal benefits. Most consumers of these products are interested because of their cannabidiol (CBD) content, which has taken the natural products industry by storm. The CBD and delta-9-tetrahydrocannabinol (delta-9-THC) concentrations in these products are often absent, and even where labeled, the accuracy of the label amounts is often questionable. In order to gain a better understanding of the CBD content, fifty hemp products were analyzed by gas chromatography coupled with mass spectrometry (GC-MS) for CBD, delta-9-THC, tetrahydrocannabinolic acid (delta-9-THCAA), and cannabidiolic acid (CBDA). Delta-9-THCAA and CBDA are the natural precursors of delta-9-THC and CBD in the plant material. Decarboxylation to delta-9-THC and CBD is essential to get the total benefit of the neutral cannabinoids. Therefore, analysis for the neutral and acid cannabinoids is important to get a complete picture of the chemical profile of the products. The GC-MS method used for the analysis of these products was developed and validated. A 10-m × 0.18-mm DB-1 (0.4 μ film) column was used for the analysis. The majority of the hemp products were oils, while one of the products was hemp butter, one was a concentrated hemp powder capsule, and another was a hemp extract capsule. Most of the products contained less than 0.1% CBD and less than 0.01% delta-9-THC. Three products contained 0.1–1% CBD, and two products contained 0.1–0.9% delta-9-THC. All of the samples appeared to be decarboxylated since the CBDA and delta-9-THCAA results were less than 0.001%. The developed method is simple, sensitive, and reproducible for the detection of delta-9-THC, delta-9-THCAA, CBD, and CBDA in CBD/hemp oil products.
Introduction
In the last two decades, there has been an escalation in cannabis use in the U.S., with growing public popularity and pressure, together with an inconsistent and confusing regulatory picture. In the U.S., the use and possession of marijuana is a federal crime; however, medical marijuana legislation has been adopted in the District of Columbia and in 33 states, while recreational marijuana use has been legalized in 14 states and U.S. territories.[1] In addition, 13 states have now passed legislation to allow certain CBD products, restricted in delta-9-tetrahydrocannabinol (delta-9-THC) content, for specific disease indications.[1] In the states in which medical marijuana has been legalized, recent studies have shown that 16–26% of medical cannabis users also consume other hemp products.[2][3] In December 2018, the passage of the “Farm Bill” (Agriculture Improvement Act of 2018) greatly accelerated the aggressive marketing of products containing cannabidiol (CBD), a constituent of the Cannabis plant. That legislation redefined “hemp” as Cannabis sativa containing < 0.3% dry weight of the psychoactive cannabinoid delta-9-THC, provided it is produced under regulations and guidelines stipulated in the statute.[4] It also removed “hemp,” so defined, as a Schedule I substance. This increasing trend of legalization has led to the production of hundreds of kinds of hemp and hemp oil products, commercialized in various forms, including oils, balms, lotions, candies, and capsules. These products contain variable concentrations of delta-9-THC and CBD.
Delta-9-THC exerts its actions through interactions with the CB1 and CB2 receptors[5]; the CB1 agonist activity is, however, responsible for giving the user a feeling of being “high” when consumed in moderation. The pharmacological effects of CBD are much less well known. It has been reported that CBD may act as an inverse agonist or antagonist on CB1 and CB2 receptors; however, this varies by cell type and the agonist ligand being studied. CBD also has activity on a number of other receptors: it antagonizes the G-protein-coupled receptor GPR55 and the transient receptor potential channel TRPM8.[7] When combined with delta-9-THC, it may serve to counter some of the psychotropic effects of delta-9-THC.[8][9]
Unfortunately, the concentration levels of these two cannabinoids are often unknown in these types of products—which are widely sold on the internet—and the labels are found to omit or inaccurately list delta-9-THC and CBD concentrations.[10][11] It is important to identify these values as the concentration is determinant of the dosage required for medical use, as well as for the determination of the legality of the possession of hemp products.
In this article, we report the development and validation of a gas chromatography coupled with mass spectrometry (GC-MS) method for the identification and quantitation of the two most principal cannabinoids, delta-9-THC and CBD (Fig. 1), in CBD oil and hemp oil products. This GC-MS method is able to analyze these cannabinoids and their acid precursors down to low concentrations, with a limit of detection (LOD) and limit of quantitation (LOQ) of 0.1 μg (absolute) and 0.25 μg (absolute), respectively, in the products tested.
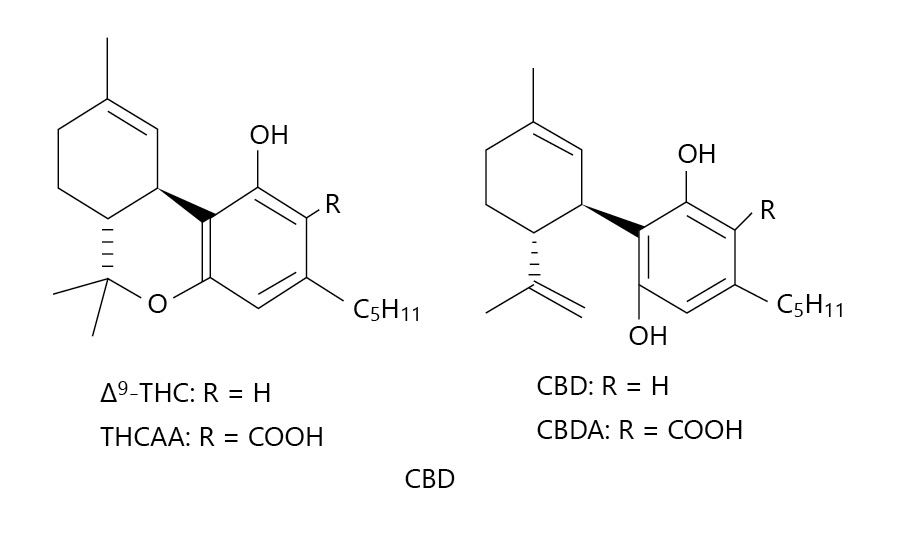
Fig. 1. Chemical structures of (−)-trans-delta-9-THC, CBD, delta-9-THCAA, and CBDA. Delta-9-THC, delta-9-tetrahydrocannabinol; CBD, cannabidiol; delta-9-THCAA, delta-9-tetrahydrocannabinol-acid-A; CBDA, cannabidiolic acid.
|
|
Materials and methods
Instrumentation and GC conditions
GC-MS analysis was performed on an Agilent Technologies 7890A gas chromatograph with an Agilent Technologies 5975C MSD and an Agilent Technologies 7693 autosampler. Separation was achieved on an Agilent Technologies 10-m × 0.18-mm DB-1 column (0.4 μ film). Helium was used as the carrier gas at a flow rate of 0.4 mL/min. The inlet was configured in splitless mode at a temperature of 250°C. The temperature program started at 180°C for 1 min and then ramped up at 15°C/min to 280°C for 5.33 min (Table 1). The total run time was ∼13 min. Retention times of all analytes are shown in Table 2. Data acquisition was performed on ChemStation G1701EA E.02.01.117. Table 3 lists the ions acquired using the SIM mode.
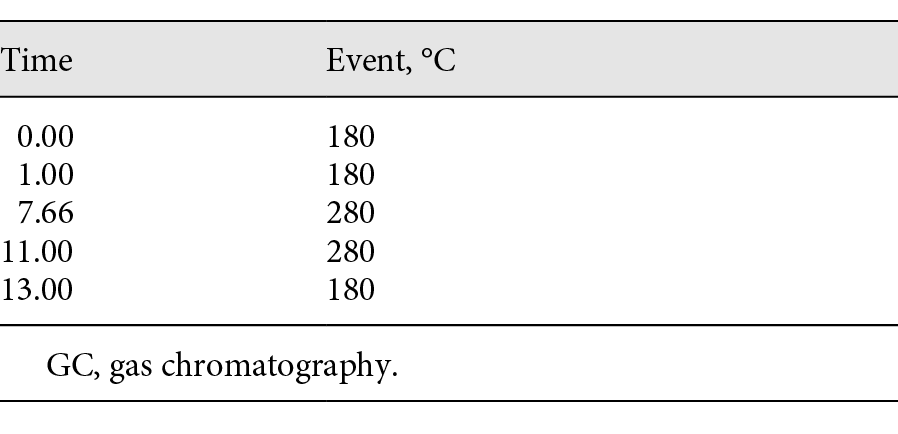
Table 1. GC temperature program
|
|
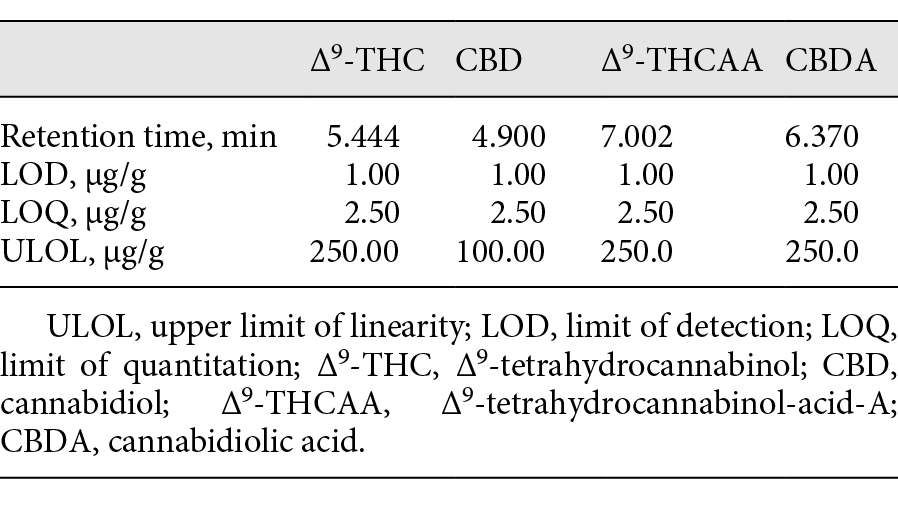
Table 2. Retention times, LOD, LOQ, and ULOL of (−)-trans-delta-9-THC, CBD, delta-9-THCAA, and CBDA
|
|
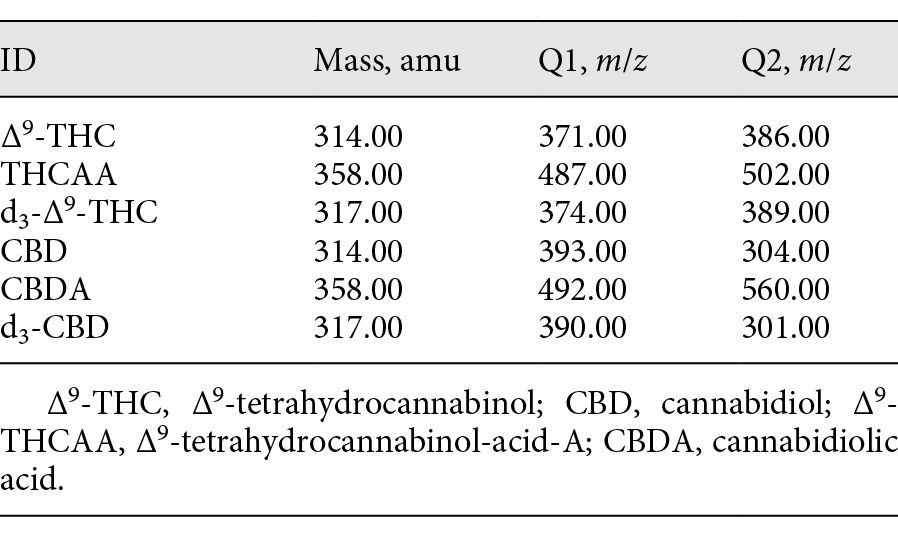
Table 3. Ions monitored for the four cannabinoids and the internal standards
|
|
Chemicals and reagents
Hexane, chloroform, and hexane ethyl acetate (9:1) were all analytical grade. BSTFA+1% TMCS was purchased from Sigma Aldrich; 1 n HCl was prepared by diluting 10 mL of concentrated HCl to 100 mL with deionized water, and 0.2 n methanolic NaOH was prepared by combining 450 mL of MeOH with 50 mL of 2 n NaOH.
Standard solutions
Two 1.0 mg/mL cannabinoid standard solutions of delta-9-THC and CBD were purchased from Cerilliant. Delta-9-THCAA (1.0 mg/mL) was purchased from Lipomed, and CBDA (1.0 mg/mL) was prepared at ElSohly Laboratories, Inc. All four 1.0 mg/mL standard solutions, delta-9-THC, CBD, delta-9-THCAA, and CBDA, as well as a 10 µg/mL dilution of each standard were used to prepare the calibration curves.
Internal standard solutions
Two 100 µg/mL internal standard solutions, d3-delta-9-tetrahydrocannabinol and d3-cannabidiol, were purchased from Cerilliant. Both internal standards were added to all samples, calibrators, and controls at a concentration of 1 µg in each test sample.
Sample preparation
An accurately weighed 50–100 mg of material was diluted with hexane to make 10 mg/mL samples. A volume of 1 mL (straight sample, 10 mg of oil) and 0.1 mL (dilute sample, 1 mg of oil) of the hexane solutions were spiked with 10 µL of d3-delta-9-tetrahydrocannabinol (100 µg/mL) and d3-cannabidiol (100 µg/mL). The solutions were adjusted to 5 mL with hexane and vortexed. To this, 4 mL of 0.2 n sodium hydroxide was added and mixed. The solution was centrifuged, and the top layer (hexane) was discarded. A volume of 1.5 mL of 1 n HCl was added to the basic layer and mixed, with the pH checked to be between 1 and 2. A volume of 1 mL of hexane was added, and the sample was mixed and centrifuged. The top layer was transferred to a GC vial and evaporated. The sample was derivatized using N,O-bis(trimethylsilyl)-trifluoroacetamide to make a trimethylsilyl derivative, followed by analysis using GC-MS.
Method validation
The validation was executed using 100 mg of a hemp oil product certified to contain delta-9-THC 5.5 µg/g, CBD 22.5 µg/g, delta-9-THCAA 7.5 µg/g, and CBDA 100 µg/g. This control was used to validate the GC-MS method with six replicates over a period of six days with four-point calibration curves (0.25, 0.5, 1.0, and 5.0 μg absolute). The accuracy was calculated using the standard addition method. The LOD, LOQ, and upper limit of linearity (ULOL) are listed in Table 2, and the accuracy, RSD, and precision for the two cannabinoids are listed in Tables 4 and 5.
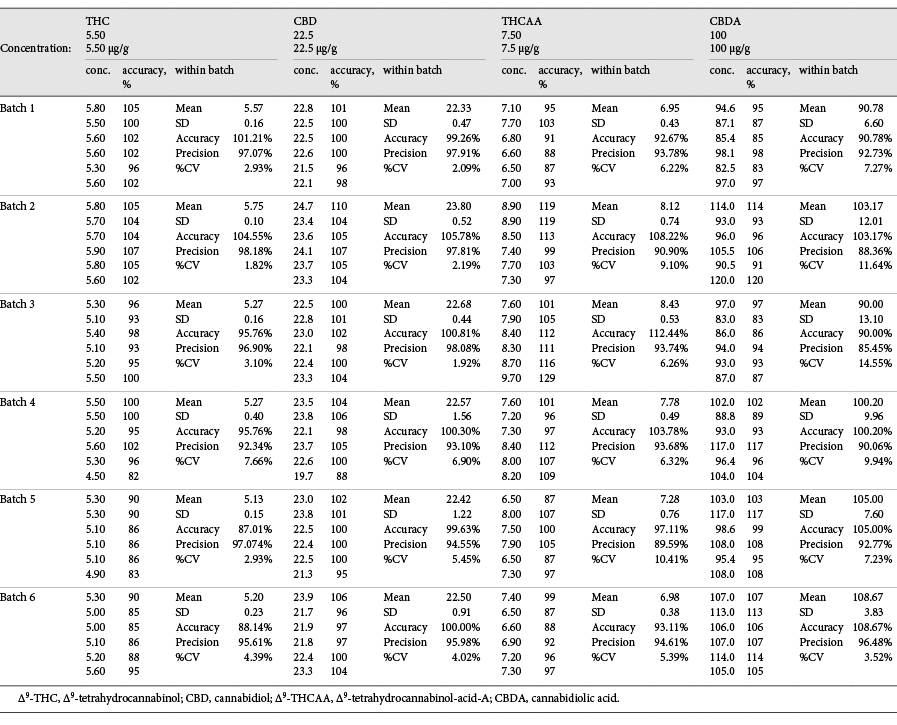
Table 4. Within-batch mean, RSD, accuracy, and precision for (−)-trans-delta-9-THC, CBD, delta-9-THCAA, and CBDA
|
|
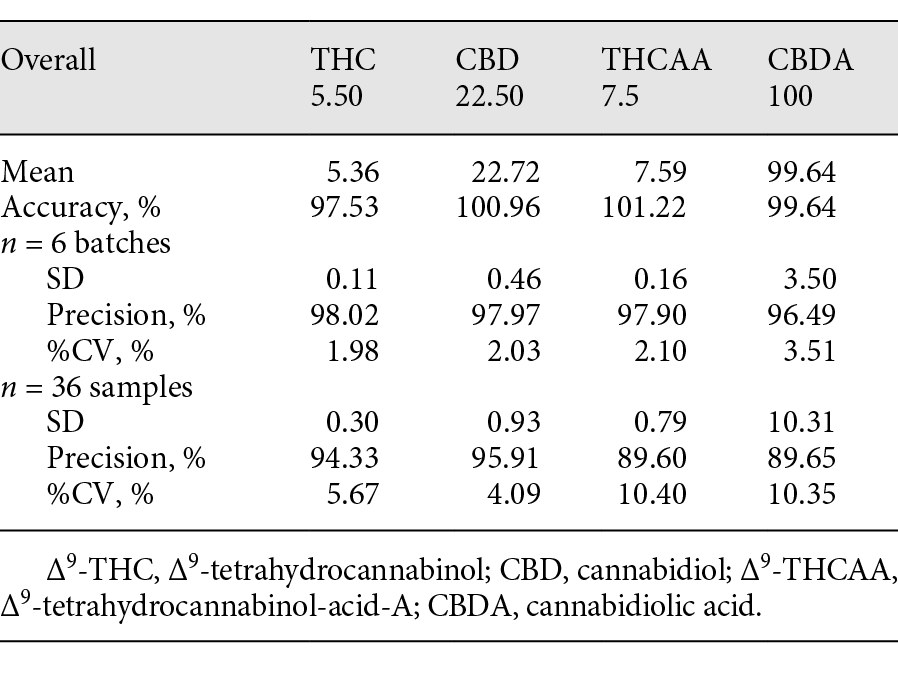
Table 5. Overall mean, RSD, accuracy, and precision for (−)-trans-delta-9-THC, CBD, delta-9-THCAA, and CBDA
|
|
Linearity
Linearity was calculated in six validation batches by using four-point standard calibration curves (2.5, 5, 10, and 50 µg/g). The concentration-response relationship of the GC-MS method indicated a linear relationship between the concentration and response ratio, with r2 values of > 0.99 for all the cannabinoids as follows: CBD (r2 > 0.9999), Δ9-THC (r2 > 1.0000), CBDA (r2 > 0.9999), and Δ9-THCAA (r2 > 0.9999).
Accuracy and RSD
References
- ↑ 1.0 1.1 National Conference of State Legislatures (10 March 2020). "State Medical Marijuana Laws". https://www.ncsl.org/research/health/state-medical-marijuana-laws.aspx.
- ↑ Grella, C.E.; Rodriguez, L.; Kim, T. (2014). "Patterns of medical marijuana use among individuals sampled from medical marijuana dispensaries in Los Angeles". Journal of Psychoactive Drugs 46 (4): 267–75. doi:10.1080/02791072.2014.944960. PMID 25188696.
- ↑ Walsh, Z.; Callaway, R.; Belle-Isle, L. et al. (2013). "Cannabis for therapeutic purposes: Patient characteristics, access, and reasons for use". International Journal on Drug Policy 24 (6): 511–6. doi:10.1016/j.drugpo.2013.08.010. PMID 24095000.
- ↑ U.S. Government Publishing Office (20 December 2018). "Public Law 115-334 - Agriculture Improvement Act of 2018" (PDF). https://www.govinfo.gov/link/plaw/115/public/334?link-type=pdf.
- ↑ Pertwee, R.G. (2005). "Pharmacological actions of cannabinoids". Handbook of Experimental Pharmacology (168): 1–51. doi:10.1007/3-540-26573-2_1. PMID 16596770.
- ↑ Pertwee, R.G.; Howlett, A.C.; Abood, M.E. et al. (2010). "International Union of Basic and Clinical Pharmacology. LXXIX. Cannabinoid receptors and their ligands: beyond CB₁ and CB₂". Pharmacological Reviews 62 (4): 588–631. doi:10.1124/pr.110.003004. PMC PMC2993256. PMID 21079038. https://www.ncbi.nlm.nih.gov/pmc/articles/PMC2993256.
- ↑ Colizzi, M.; Bhattacharyya, S. (2017). "Does Cannabis Composition Matter? Differential Effects of Delta-9-tetrahydrocannabinol and Cannabidiol on Human Cognition". Current Addiction Reports 4 (2): 62-74. doi:10.1007/s40429-017-0142-2. PMC PMC5435777. PMID 28580227. https://www.ncbi.nlm.nih.gov/pmc/articles/PMC5435777.
- ↑ Schubart, C.D.; Sommer, I.E.C.; van Gastel, W.A. et al. (2011). "Cannabis with high cannabidiol content is associated with fewer psychotic experiences". Schizophrenia Research 130 (1–3): 216-21. doi:10.1016/j.schres.2011.04.017. PMID 21592732.
- ↑ Vandrey, R.; Raber, J.C.; Raber, M.E. et al. (2015). "Cannabinoid Dose and Label Accuracy in Edible Medical Cannabis Products". JAMA 313 (24): 2491-3. doi:10.1001/jama.2015.6613. PMID 26103034.
- ↑ Bonn-Miller, M.O.; Loflin, M.J.E.; Thomas, B.F. et al. (2017). "Labeling Accuracy of Cannabidiol Extracts Sold Online". JAMA 318 (17): 1708-1709. doi:10.1001/jama.2017.11909. PMC PMC5818782. PMID 29114823. https://www.ncbi.nlm.nih.gov/pmc/articles/PMC5818782.
Notes
This presentation is faithful to the original, with only a few minor changes to presentation. Some grammar, punctuation, and repetition was cleaned up in the title and text to improve readability. In some cases important information was missing from the references, and that information was added. Nothing else was changed in accordance with the NoDerivatives portion of the license.


