Difference between revisions of "Journal:Avoidance of operational sampling errors in drinking water analysis"
Shawndouglas (talk | contribs) (Saving and adding more.) |
Shawndouglas (talk | contribs) (Saving and adding more.) |
||
| Line 446: | Line 446: | ||
==Conclusions== | ==Conclusions== | ||
To achieve accurate results in water analysis, it is essential that sampling is carried out correctly. To help fulfill this objective, this work presents an adverse event reporting and learning system, developed specifically for the sampling phase, that aims to improve the quality of drinking water and, therefore, contributes to the promotion of public health. The key contribution of this work is related to the quantification of the QoI imbedded in CT, and addressing the issues pertaining to incomplete information using the LP paradigm. The proposed approach allows to identify in advance the causes that lead to adverse events, enabling the formulation of action plans to avoid or, at least, minimize them. The construction of a CT for a particular event is often time-consuming and difficult, because initially it requires the development of branches for each possible cause. However, after this stage is passed, the process of classification and analysis of adverse events becomes a speedier and easier exercise. A computation of the QoI enables the ranking of possible causes and the identification of the ones that should be prioritized. Consequently, in the construction of a CT, it is mandatory to look for all possible causes, not only the most probable or the usual ones. | |||
The adverse event reporting and learning system presented allows knowledge extraction, i.e., the identification of the main failure causes, possible trends, areas requiring improvement plans, or changes in procedures. The automatic reports generated by the system are reliable. In fact, the quantification on-the-fly of the QoI of the logic terms used in the process of judgement (given in terms of a theorem to be proved) minimizes user participation, which is only necessary to approve the recommendations. One of the main advantages of the proposed system has to do with its modularity. This feature allows one to update the system at any time (e.g., add new categories, subcategories, and/or causal trees) without changing its structure or way of functioning. | |||
==Acknowledgements== | |||
===Funding=== | |||
This work has been supported by FCT – Fundação para a Ciência e Tecnologia within the R&D Units Project Scope UIDB/00319/2020 and UIDB/50006/2020. | |||
===Conflict of interest=== | |||
None stated. | |||
==References== | ==References== | ||
Revision as of 20:51, 28 January 2023
| Full article title | Avoidance of operational sampling errors in drinking water analysis |
|---|---|
| Journal | AQUA - Water infrastructure, Ecosystems and Society |
| Author(s) | Fernandes, Ana; Figueiredo, Margarida; Ribeiro, Jorge; Neves, José; Vicente, Henrique |
| Author affiliation(s) | Universidade Lusófona, Universidade de Évora, Instituto Politécnico de Viana do Castelo, Instituto Universitário de Ciências da Saúde, Universidade do Minho |
| Primary contact | Email: hvicente at uevora dot pt |
| Year published | 2022 |
| Volume and issue | 71(3) |
| Page(s) | 373–386 |
| DOI | 10.2166/aqua.2022.074 |
| ISSN | 2709-8036 |
| Distribution license | Creative Commons Attribution 4.0 International |
| Website | https://iwaponline.com/aqua/article/71/3/373/87050 |
| Download | https://iwaponline.com/aqua/article-pdf/71/3/373/1026718/jws0710373.pdf (PDF) |
|
|
This article contains rendered mathematical formulae. You may require the TeX All the Things plugin for Chrome or the Native MathML add-on and fonts for Firefox if they don't render properly for you. |
|
|
This article should be considered a work in progress and incomplete. Consider this article incomplete until this notice is removed. |
Abstract
The internal audits carried out in the first half of 2019 in water laboratories as part of quality accreditation in accordance with ISO/IEC 17025:2017 showed a high frequency of adverse events in connection with sampling. These faults can be a consequence of a wide range of causes, and in some cases, the information about them can be insufficient or unclear. Considering that sampling has a major influence on the quality of the analytical results provided by water laboratories, this work presents a system for reporting and learning from adverse events. Its aim is to record nonconformities, errors, and adverse events, making possible automatic data analysis to better ensure continuous improvement in operational sampling. The system is based on the Eindhoven Classification Model and enables automatic data analysis and reporting to identify the main causes of failure. Logic programming is used to represent knowledge and support the reasoning mechanisms to model the universe of discourse in scenarios of incomplete, contradicting, or even unknown information. In addition to suggesting solutions to the problem, the system provides formal evidence of the solutions presented, which will help to continuously improve drinking water quality and promote public health.
Keywords: drinking water, Eindhoven Classification Model, Knowledge Representation and Reasoning, logic programming, sampling errors, water quality, decision support system
Highlights:
- An adverse event reporting and learning system for water sampling is described.
- The Eindhoven Classification Model is extended and adapted for water sampling.
- Logic programming is used for knowledge representation.
- The proposed system can deal with insufficient or ambiguous information.
- The system allows users to identify the relevant issues behind the errors that may occur.
Introduction
Securing water quality for human consumption through a public supply system is an essential element of health policy. By the end of the nineteenth century, an assessment and control of risks to human health from transmission of diseases caused by water consumption had been carried out empirically on the basis of the physical appearance of water. [Bagchi 2013] Epidemiological studies conducted by John Snow showed a close association between the consumption of water with fecal contamination and a cholera outbreak in London. [Snow 1855] The discovery of the existence of microorganisms by Louis Pasteur in 1863 and the isolation of Vibrio cholera bacillus in 1883 by Robert Koch formed the crucial scientific basis for the association of water use with public health and served as a starting point for the establishment of practices and protocols to control water quality. [Geison 1995; Brock 1999]
Until the middle of the twentieth century, the quality of water for human consumption had been largely assessed based on its organoleptic characteristics, i.e., its colorless, tasteless, and odorless features. [Eaton et al. 2017] However, this type of assessment does not guarantee the protection of public health from pathogenic microorganisms and hazardous chemicals. Therefore, it is imperative to establish standards based on quantifiable parameters that define the properties of water for human consumption in terms of microbiological, physical, chemical, and radiological factors. [ISO/IEC 17025 2017] Current methods of controlling water quality are time-consuming and complex, and they involve the use of significant technical and financial resources (e.g., calibrated equipment, infrastructure, skilled technicians, and reagents). With all this complexity, a large number of errors and failures can occur. [Byleveld et al. 2008] A failure can be defined as a planned action not meetings its required end result, at times because of use of an incorrect plan. These failures can be in connection with products, processes, and systems. [Hommerson et al. 2008]
The best way to prevent similar errors and failures from happening again is to report them, i.e., create experiential learning systems to identify their causes. Although this approach is widely used in the water sector, it is important to note that classification systems work better when they are limited to a specific field/stage/phase (e.g., pre-analytical, analytical, and post-analytical phases). Sampling is an important stage in a water quality control program as it can affect results if a sample is not representative of the water being controlled. On the one hand, sampling errors can arise if the sampling is not designed to answer specific questions (usually regulators specify the sampling approach and the sampling design to be adopted). On the other hand, sampling errors can also be related to operational issues.
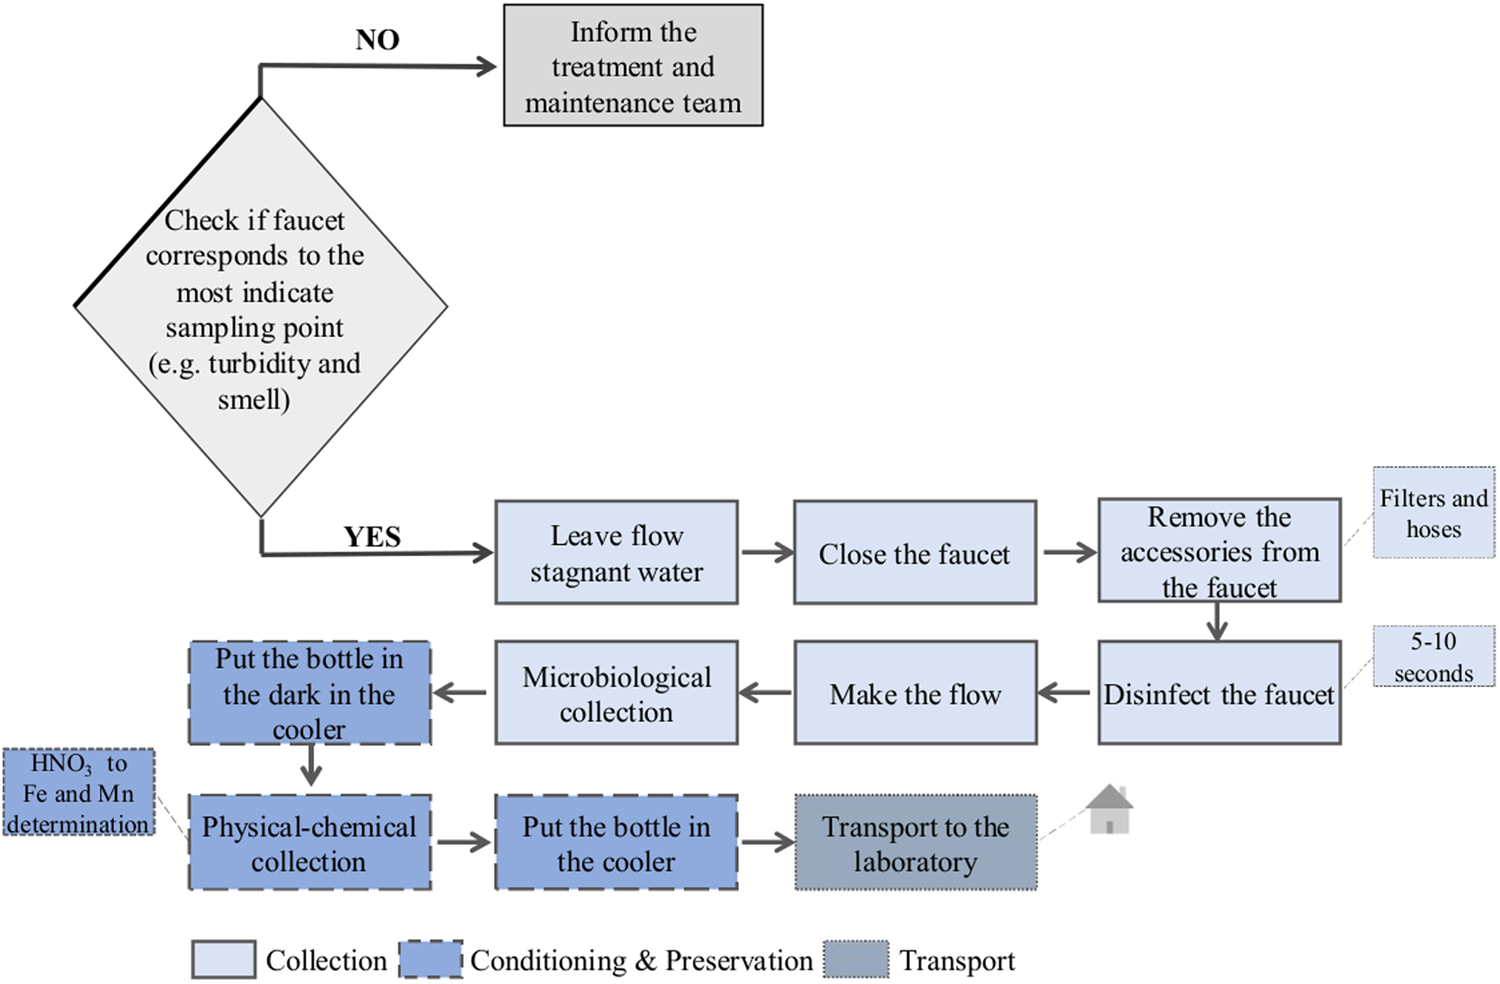
In this work, a system for reporting and learning from errors is presented, with the aim of describing and preventing those that occur in operational sampling of water for human consumption. The operational sampling of water for human consumption involves four main steps: collection, conditioning, preservation, and transportation. These steps are depicted in Figure 1. Water samples are delivered to the laboratory for analysis, and the sampling technician is responsible for taking a valid and representative sample. [Li & Migliaccio 2011]
|
Due to the increasing importance attached to the representativeness of sampling, greater emphasis has been placed on the adequate collection, conditioning, preservation, and transport of samples. Thus, it is advisable that laboratories help to plan a sampling program in partnership with their customers. This partnership is essential to ensure that the selection of samples is adequate in order to minimize errors and to correspond to the needs of the consumer. [Nollet & Gelder 2014] At this point, it is important to reiterate that the main goal of water analysis is to aid the decision-making process.
Thus, the reliability of the decisions made depends on the variability of the experimental results. Despite variability being inherent to natural systems, if the variability due to errors in sampling, transport, handling, and/or analysis is underestimated, wrong decisions can be made, with negative consequences for health, environment, and financial matters, just to name a few. Indeed, the errors that occur during the water analysis process are difficult to quantify. Inadequate training, over-reliance on automated systems, and complicated software resources are some of the relevant issues behind the errors that may occur. [Reason 2000] More broadly, knowledge is crucial to solve the problems of the economy and society. In everyday situations, however, the information that flows from various sources is often incomplete, inaccurate, uncertain, contradictory, and even unknown. On the other hand, existing models are built based on some idealizations that remove these real-world properties.
The result is a system that, due to its inability to model the world or universe of discourse, never delivers the expected answers. [Parsons 1996] In the water sector, particularly with regard to sampling errors, there are many situations where the information available on errors is insufficient or ambiguous. The system proposed in this work is based on the Eindhoven Classification Model (ECM) [van der Schaaf 1995] and focuses on avoiding the causes of errors by applying a model specially developed for the operational sampling phase.
The ECM was created to address human error in the chemical process industry and has since been applied in different areas. [Henneman et al. 2006; Raab et al. 2006; Simmons & Graves 2008; Rodrigues et al. 2011; Vicente et al. 2015; Fernandes et al. 2019] The ECM classifies two types of errors, namely, human or active errors and latent ones. With regard to human error, the ECM incorporates Rasmussen's SRK thematic, which includes three levels of behavior, namely, competence-based, rule-based, and knowledge-based behavior levels. [Rasmussen 1976] In the case of latent errors, the ECM differentiates between technical and organizational errors [van der Schaaf 1995] The former occurs when there is an obstacle associated with physical components (e.g., devices and physical installations), while the latter is associated with protocols, procedures, or knowledge transfers.
The main objective of this work is to present an adverse event reporting and learning system, developed specifically for the sampling phase. Based on the internal audits carried out in the first half of 2019 in Portuguese water laboratories, the adverse event "Failure in Sampling" was chosen to demonstrate how the proposed system can be applied to real-world problems. This system, known as Adverse Event Reporting and Learning System related to Water Sampling (AERLS-WS), intends to record the nonconformities, errors, and adverse events that occur during sampling. It also intends to be a learning system that enables data analysis to ensure continuous improvement in drinking water quality and the promotion of public health.
Related work
The need for accurate predictions of water quality has encouraged researchers to develop new methods and improve the predictive capabilities of traditional ones. This includes artificial intelligence (AI)–based problem-solving methods, which have seen adoption in the water industry. Several studies in the literature illustrate the application of these tools for quality water control, but very few relate to drinking water. Indeed, water quality modeling is a powerful tool for studying, describing, and predicting the ecological status of an aquatic ecosystem. Morales-Torres et al. [2016] presented a study about the use of sustainable drainage systems to manage urban runoff, aiming to contribute to environmental and landscape improvement. The authors developed a tool to analyze the impact of storm water management on the urban environment and introduced energetic and environmental criteria in the decision-making process. Stefanovic et al. [2015] developed a web-based system to manage Serbian reservoirs. The authors created a software that brings together all the relevant actors, processes, data sources, and applications. The software allows for testing different organizational scenarios, due to its flexibility, extensibility, and the fact that it could be customized. Allan et al. [2013] studied the effects of regulation, proprietorship, and business culture on risk management within the water sector. The authors stressed that a paradigm shift is necessary. The water sector should move from a reactive to a pro-active risk management culture based on knowledge. However, the authors stated that there is a gap in the understanding of the drivers required to bring about such a change. Pearson et al. [2010] presented a decision support system to support managers in the urban water sector. The proposed system aims to shift decision-making from the conventional standards to a sustainable, inclusive, and dynamic paradigm, anchored by social learning and commitment. The authors stressed the value of the basic units of social learning, i.e., knowledge transfer for transformation, monitoring and evaluation of the decision-making process, and stakeholder engagement.
In the water sector, there are many situations in which information is incomplete. However, most of the decision support systems ignore this fact. Most of the time, such systems do not provide the expected answers due to their inability to represent the universe of discourse. Thus, it is of utmost importance to deal with defective information. In this context, the use of the logic programming (LP) paradigm to express theories has grown in recent years, and many other fields have started using its tools and methodologies. Theories are typically expressed as a succession of rules and facts that allow to deduce non-logical consequences using logical inferences. [Fernandes et al. 2020] According to the extension to the LP language presented in Neves [1984], both explicit (or strong) negation and explicit declarations may be used in the establishment of rules and facts. Furthermore, theories can be enhanced by adding special rules in the form of invariants to specify the context under which the universe of discourse should be understood. Such invariants specify the conditions that must be met and must have overall consistency, i.e., it must not be possible to infer a conclusion and its contradiction. [Neves 1984; Kakas et al. 1998; Neves et al. 2021] This extension to the LP language uses the open-world assumption (OWA), i.e., everything is unknown or undefined until one has some secure evidence of its truthfulness or falseness. [Keet 2013] The OWA differs from the more usual closed-world assumption (CWA), where everything is assumed false until there is solid evidence of its truthfulness. [Keet 2013] The use of the OWA is the main advantage of the method used, since it allows to deal with incomplete, inconsistent, contradictory, default, or forbidden information, and the conclusions are an object of a formal proof. Indeed, this point is of utmost importance, since in the real world, information is incomplete and updateable.
Methods
The ECM was initially conceived to address errors in the chemical industry [van der Schaaf 1995] and has since been adapted to be used in different areas, e.g., the steel industry, power generation, healthcare, water distribution, or public administration. [Henneman et al. 2006; Raab et al. 2006; Simmons & Graves 2008; Rodrigues et al. 2011; Vicente et al. 2015; Fernandes et al. 2019] In this work, an adjusted version of the ECM was conceived, with extensions and adaptations for water sampling scenarios, as well as causal trees (CTs) that describe the root causes of errors. The data used in this work were obtained during the first semester of 2019, in internal audits carried out at the Water Laboratory of Santiago do Cacém Municipality (located in Alentejo Litoral, southern Portugal), within the scope of ISO/IEC 17025:2017 quality accreditation. Checklists were used to record nonconformities. In the checklists, verified observations were organized according to the general and specific requirements of the ISO/IEC 17025 standard. In this work, the nonconformities were classified into major nonconformity, minor nonconformity, opportunity for improvement, and in terms of the ECM, referred to as adverse events or errors.
The formal approach of the proposed errors reporting system in water sampling is based on the LP paradigm for problem-solving and is set according to an extension to the LP language. [Neves 1984] Undeniably, there are many approaches to knowledge representation and reasoning (KRR) using the epitome of LP, namely, in the areas of model theory and proof theory. In this article, the Proof Theoretical approach for problem-solving was adopted and conveyed as an extension of the LP language. Indeed, an extended logic program (ELP) is grounded on a specified ensemble of clauses in the form of Program 1:
|
...where pi, qj, and p stand for a set of predicates. A predicate is the part of a sentence that contains the verb and tells something about the subject. In Program 1, "," designates "logical and" while "?" denotes "falsity." The classical negation sign "⌝" denotes a strong declaration, whereas "not" denotes negation by failure, i.e., a collapse in demonstrating a certain statement, since it is not declared in an explicit way. [Neves 1984] According to this way of thinking, a set of exceptions are presented in every program [Neves 1984], i.e., clauses in the form:
...that denotes data, information, or knowledge that cannot be ruled out. On the other hand, clauses of the type:
...are invariants that make it possible to specify the context under which the universe of discourse should be understood. [Neves 1984]
In order to isolate a customized version of the ECM for a particular problem, it is of the utmost importance to identify all the causes that lead to such an undesirable event. To adapt the ECM to the problems related to the sampling of water for human consumption, new dimensions have been considered. These dimensions aim to adjust the original model to the sampling context and provide a general view of the events that can happen. The Adjusted version of ECM for Water Sampling (A-ECM-WS) followed the dimensions "technical," "organizational," "human behavior," and "other," presented in Table 1.
| ||||||||||||||||||||||||||||||||||||||||||||||||||||||||||||||||||||||||||||||||||||||||||
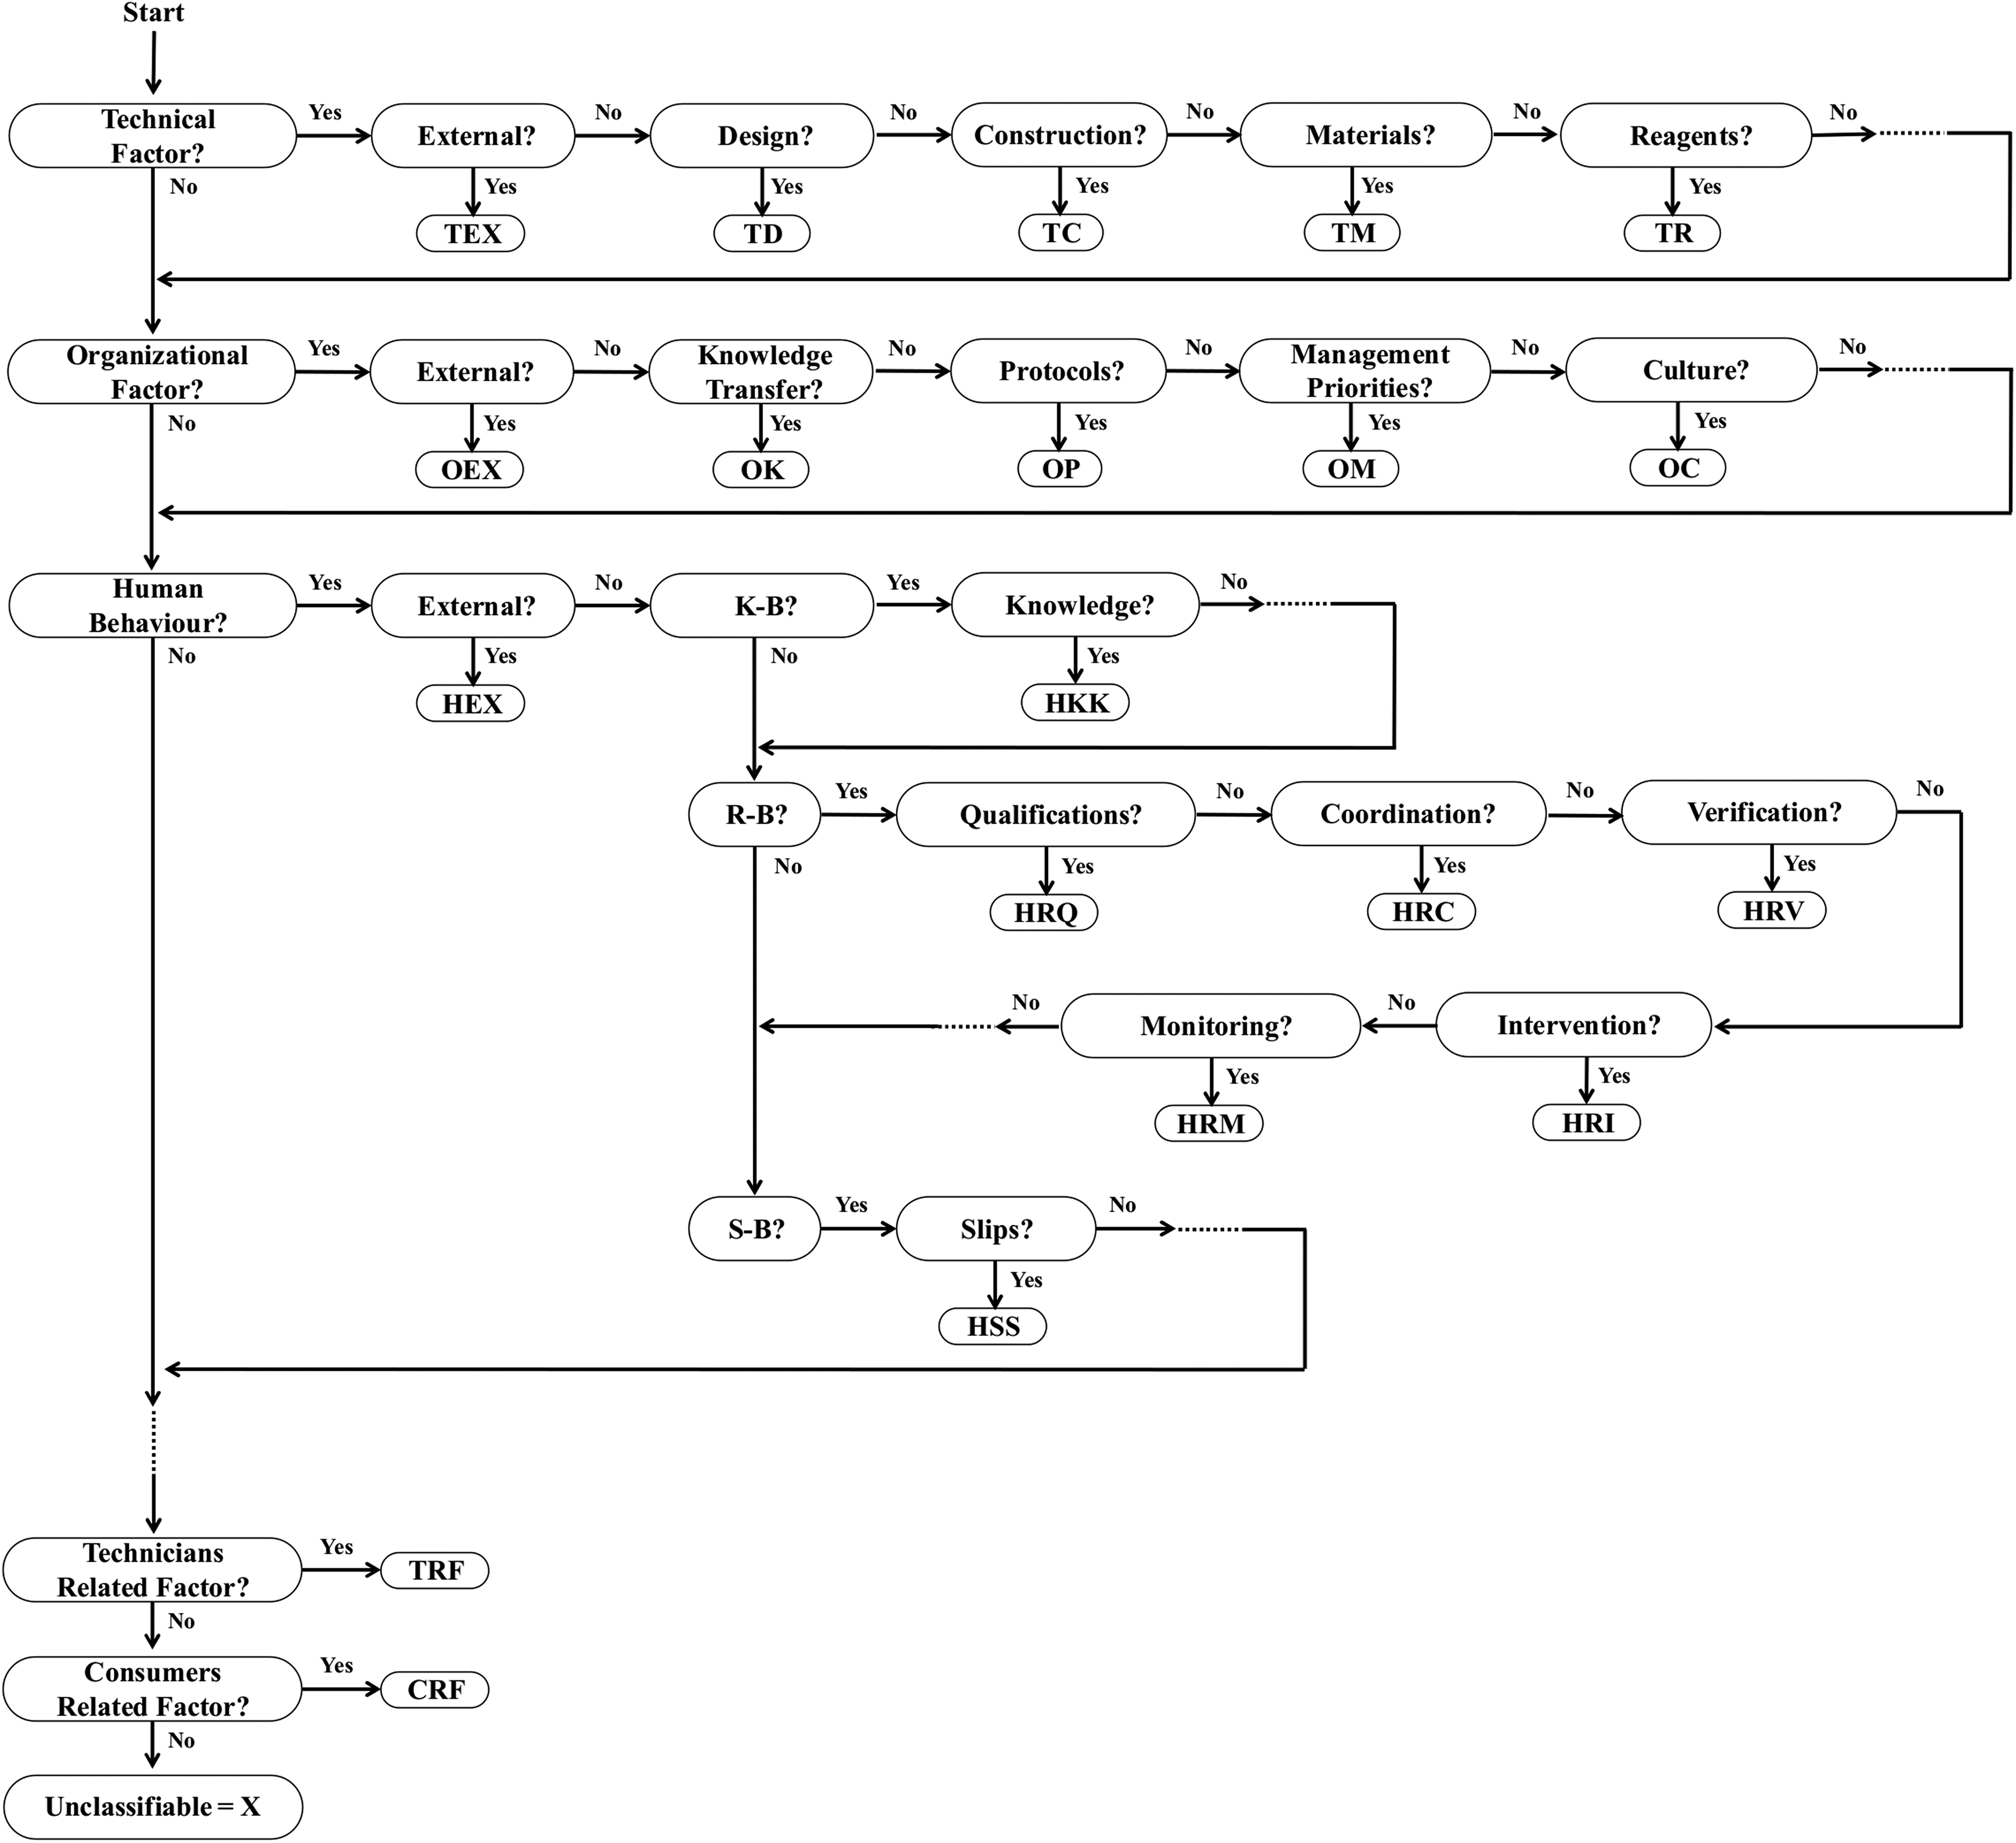
Table 1 also shows the categories included in each dimension, as well as a brief description and the corresponding codes. To illustrate the type of adverse events that can be included in each code, Table 2 presents a few examples. Thus, based on Tables 1 and 2, the systematization of the causes that lead to an adverse event becomes straightforward and effective, being processed according to the flow chart presented in Figure 2. For instance, an adverse event assigned to the category "Organizational dimension – Protocols" (OP) occurs due to the quality/availability of the internal procedures. The events assigned to this category arise from difficulties in execution or interpretation of unclear protocols that can lead to adverse events such as the failure of not flowing the stagnant water in the faucet or the failure to remove the faucet accessories.
| ||||||||||||||||||||||||
|
The ECM makes use of root cause analysis to classify adverse events through codes established in advance. [van der Schaaf 1995] Thus, beyond the classification framework presented above, CTs regarding each adverse event should be conceived. CTs can be considered as a hierarchical representation of an adverse event, allowing to identify the circumstances that lead to its occurrence. [van der Schaaf & Habraken 2005] The original version of the ECM only comprises cases for which the causes of adverse events are well known. This fact should be a limitation, since in many situations information about errors and adverse events can be incomplete, unknown, or even contradictory. To include the uncertainty that is always present in real situations, in the present work, the unknown and forbidden operators were considered in the conception of the extended causal trees (ECTs).
Application
Table 3 lists the adverse events and the number of occurrences recorded in the internal audits carried out in the Water Laboratory of Santiago do Cacém Municipality (located in Alentejo Litoral, southern Portugal) during the first semester of 2019. A perusal of Table 3 reveals that 128 adverse events occurred. Considering the general requirements of the ISO/IEC 17025 standard, 28.9% of the occurrences were related resource requirements, 53.9% were associated with processes requirements, and 17.2% were linked to management system requirements. In terms of nonconformities, 81.2% were classified as a minor nonconformity (N) and 18.8% corresponded to a major nonconformity (M).
| |||||||||||||||||||||||||||||||||||||||||||||||||||||||||||||||||||||||||||||||||||
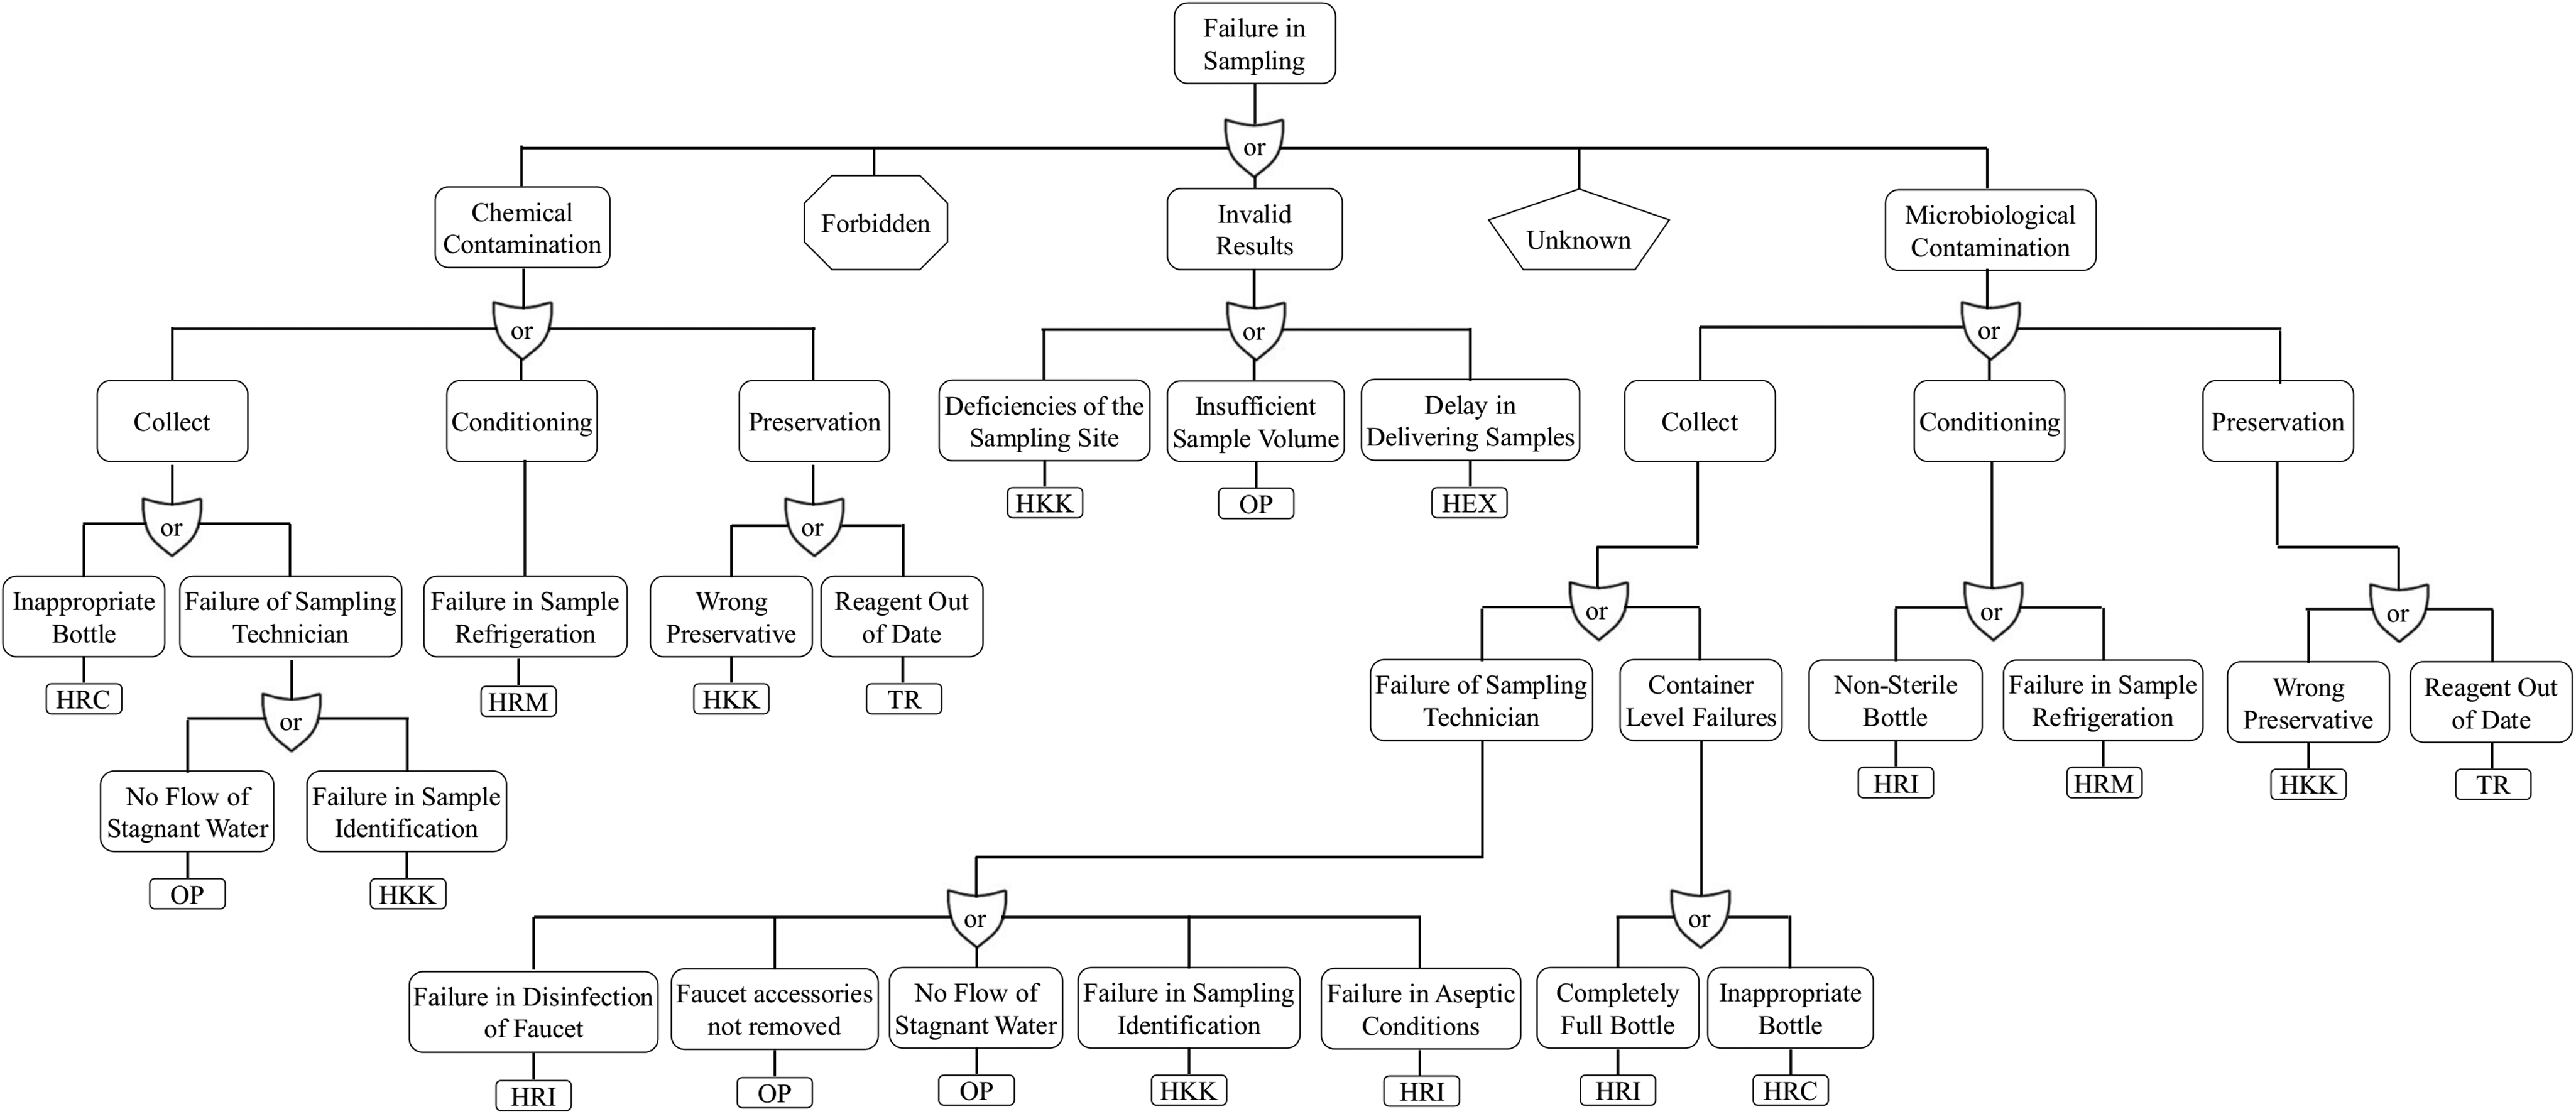
Considering the data presented in Table 3, it can be argued that the sample-related adverse events occur much more frequently than the others, which require special attention. From the nonconformities recorded during the first semester of 2019, it is feasible to specify the actions and causes that contribute to the occurrence of the adverse event "Failure in Sampling." The ECT presented in Figure 3 was established with the collaboration of sampling technicians and address the "Failure in Sampling" adverse event. The ECT was the subject of an in-depth study before its final structure took shape. The ECT contains feasible causes, being a symbolic depiction of a problem. Each branch of the ECT describes the causes of a particular adverse event.
|
To illustrate the operating mode of the A-ECM-WS, the undesired event "Failure in Sampling" and the respective causal tree (Figure 3) were considered. Taking into account the fact that an adverse event can emerge due to several causes that should be considered simultaneously or separately, AND/OR-nodes were incorporated in the CT. Furthermore, the operators "unknown" and "forbidden" were also added to express events for which the causes are unknown, forbidden, or not permitted. Therefore, taking into account the information available in Figure 3, the following different scenarios can be examined:
- Scenario A – The "Failure in Sampling" was due to microbiological contamination caused by the non-removal of the faucet accessories.
- Scenario B – The "Failure in Sampling" was due to chemical contamination caused by a failure in sample preservation.
- Scenario C – A "Failure in Sampling" has occurred. The causes behind the event were not recorded.
- Scenario D – A "Failure in Sampling" has occurred. The causes of the adverse event were not recorded due to the internal rules of the company.
In Scenario A, the cause of the adverse event was recorded, corresponding to a known value. Scenario B corresponds to a situation in which the cause that led to the adverse event is unknown. However, it is possible to lay down a finite set of causes that can lead to its occurrence, configuring a situation of an unknown value in a finite set of values (two in this example: wrong preservative or expired reagent). In Scenario C, the occurrence of the adverse event was recorded, but nothing is known about its cause, corresponding to an unknown value. Finally, Scenario D involves a forbidden or a not-allowed value, since it is not permitted to know the causes of the adverse event.
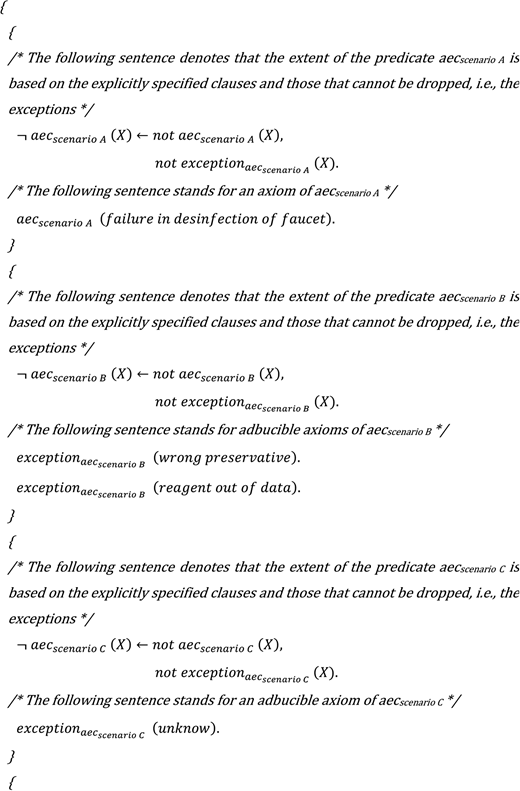
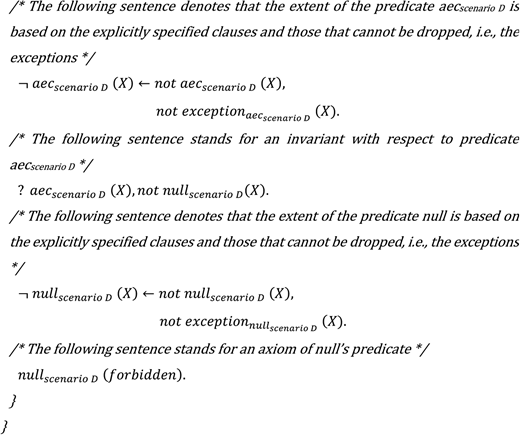
The four scenarios described above can be depicted in Program 2, following the archetype presented in Program 1, in terms of the extent of predicate adverse_event_cause (aec), namely:
|
In decision-making processes, it is necessary to consider only the most promising answers. Thus, each answer must be tested in terms of its ability to adapt to dynamic environments (i.e., environments that are constantly updated) to choose the most appropriate action from a wide range of alternatives. The optimal response, in terms of the LP paradigm, is a logic program or theory that models the universe of discourse, maximizing the quality of information (QoI). [Vilhena et al. 2016; Coelho et al. 2017] The QoI with respect to a generic predicate p can be analyzed in four situations and can be measured in the interval [0, 1]. With regard to cases in which information is known, the QoI for the extension of predicate p is 1. For cases where information is unknown, the QoI is given by the following:
...where N stands for the number of terms or clauses of the extension of predicate p. For cases in which information is unknown but can be selected from a set of possible values, although only one can be considered, the QoI is given by the following:
...where Card is the cardinality of the set of exceptions of p. If more than one value can be considered, the QoI is given by the following:
...where us a card-combination subset, with Card elements. [Vilhena et al. 2016; Coelho et al. 2017]
The information included in the ECT was depicted in terms of the LP paradigm through the extensions of a predicate set (Program 2), which make possible to evaluate the QoI regarding each of the scenarios described above. In the case of Scenario A, there is no doubt about the cause of the adverse event. The sampling failure was caused by the non-removal of the faucet accessories, with QoI being equal to 1. In Scenario B, the cardinality of the set of exceptions of the predicate is 2, i.e., the usage of a wrong preservative or an out-of-data reagent, with QoI being equal to 1/2. Finally, in Scenarios C and D, it is known that the adverse event took place, but its causes are unavailable. Any value presented in the ECT can be assumed as a feasible solution and the QoI is 0.
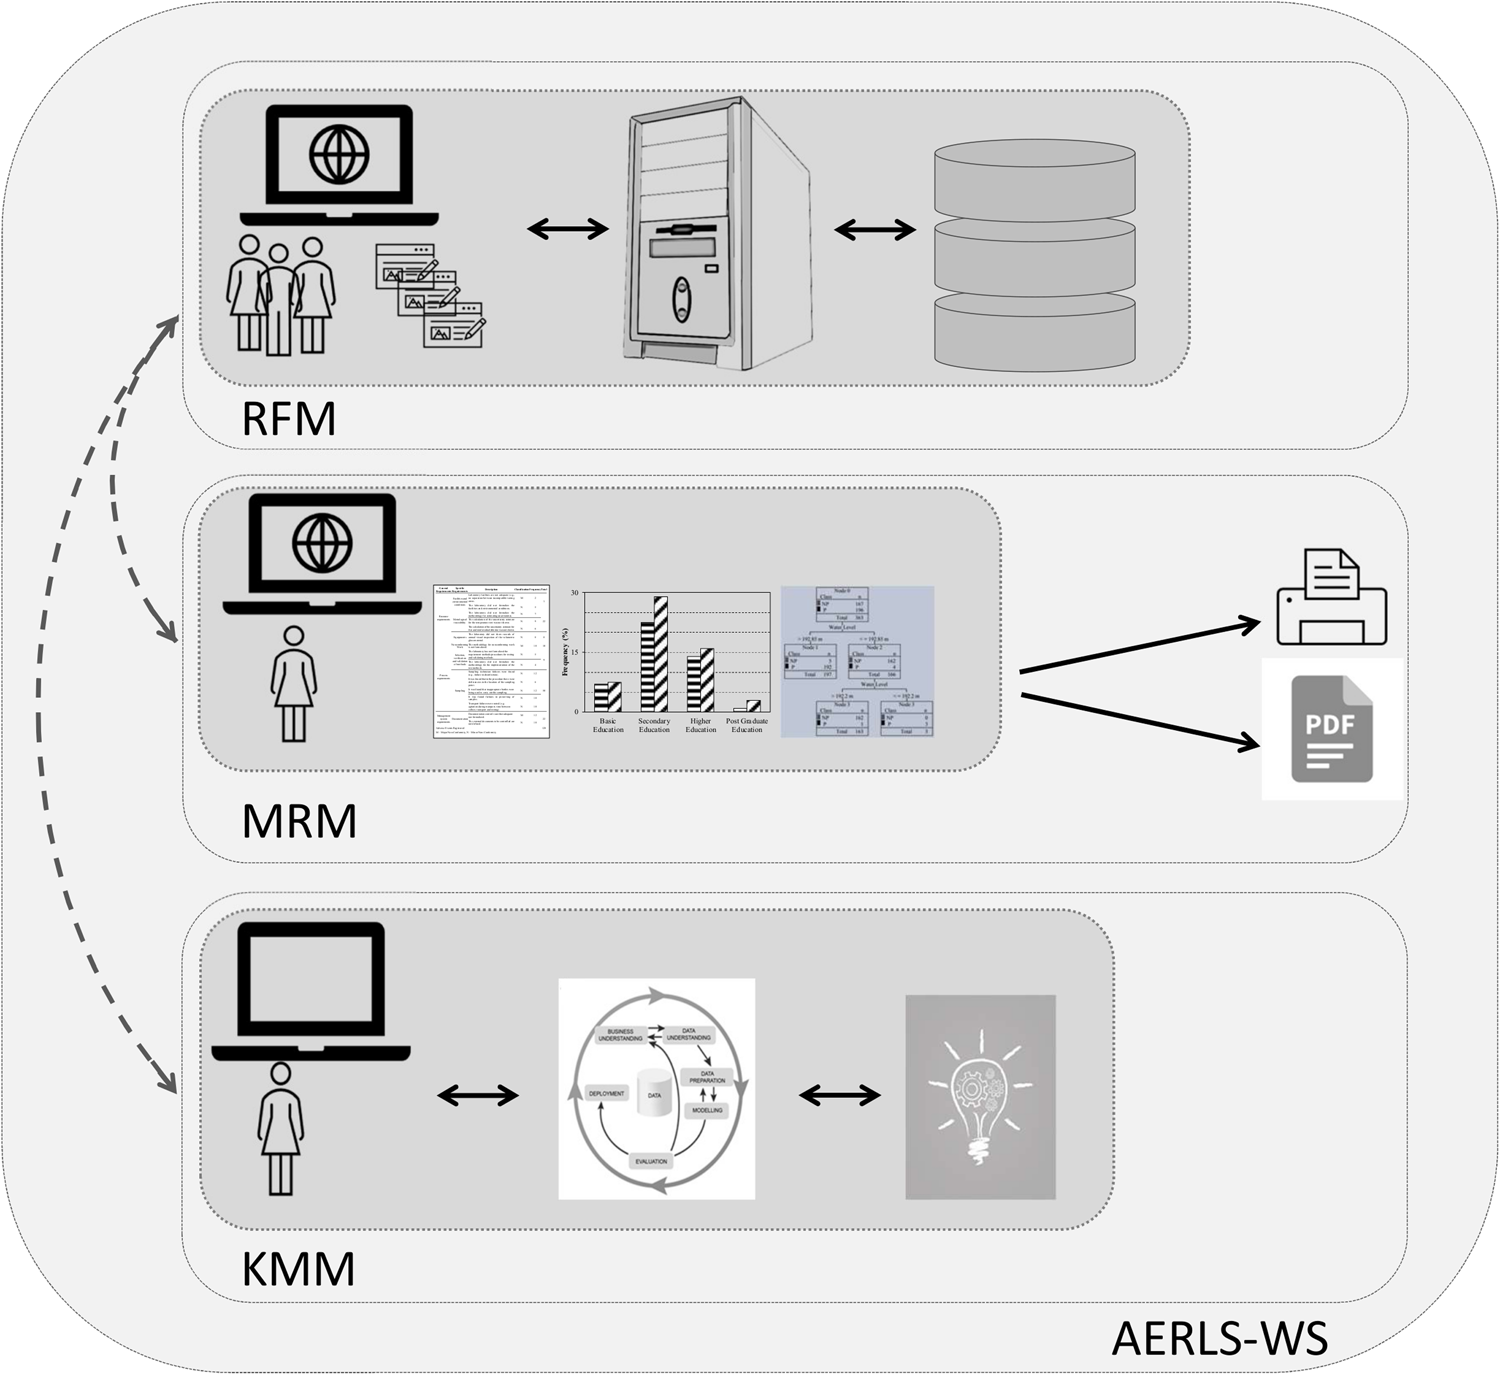
Using the formal approach based on the LP paradigm mentioned above, an AERLS-WS was developed. In addition to recording adverse events, the AERLS-WS is an information management system that provides a knowledge base where it is possible to use data mining tools. Thus, the AERLS-WS includes three main modules, as shown in Figure 4. The Reporting Forms Module (RFM) allocates the web interface that allows the registration of adverse events. The recording can be carried out by any laboratory employee, regardless of the department, by way of predefined forms adapted to each user profile (e.g., sampling technicians, chemical/microbiological technicians, technical managers, and management team). Bearing in mind what has just been mentioned, the focus in the development of this interface was its usability.
|
The Manager Reports Module (MRM) is equally a web interface. It intends to make possible analysis of the adverse events previously recorded in the RFM, having the A-ECM-WS subjacent. The A-ECM-WS allows that the system provides suggestions for improvements to minimize or eliminate organization failures. Thus, the system can automatically issue individual reports for the adverse events recorded, as well as details in terms of the branches of the ECT. The improvement suggestions contained in the reports are due to the methodology followed, which combines an adjusted version of the ECM for water sampling and LP for knowledge representation and supports the reasoning mechanisms. The system's reports are essential to ensure the quality of laboratory results, since the time and resources required to study the causes of the events, to make inferences, and to establish patterns and trends are substantially reduced. In this way, this task (which is usually time-consuming) can be performed rapidly, which in turn contributes to further avoiding or mitigating failures.
In addition, once the data are stored in the same database, they are always available for further studies. The MRM can provide updated information about the impact, occurrence, and type of events recorded. The user can choose how the information is displayed (e.g., bar charts, pie charts, tables, and tree diagrams). Based on the system's reports, the user can have information about the contribution of each possible action/cause to the adverse event. For example, for the adverse event corresponding to Scenario A (i.e., failure in sampling due to microbiological contamination caused by the non-removal of the faucet accessories), the report generated by the system informs how many times it occurred, the places and dates of the occurrences, and the error consequences (e.g., invalid analysis) and recommends remedial actions to minimize the problem (e.g., the report suggests that sampling technicians should pay careful attention to sampling rules for microbiological analysis). Moreover, based on the reports provided by the system, the management team can assess the need to provide training to sampling technicians. It should be noted that the actions/causes were identified by the system automatically, considering the A-ECM-WS and the ECTs, in turn contributing to avoiding or overcoming the identified issues and errors.
Lastly, the Knowledge Manager Module (KMM) is a Java application. This module makes use of the records stored in the database to generate a knowledgebase from which other relevant studies (e.g., through the use of data mining tools) aiming to optimize the sampling procedures can be carried out.
Conclusions
To achieve accurate results in water analysis, it is essential that sampling is carried out correctly. To help fulfill this objective, this work presents an adverse event reporting and learning system, developed specifically for the sampling phase, that aims to improve the quality of drinking water and, therefore, contributes to the promotion of public health. The key contribution of this work is related to the quantification of the QoI imbedded in CT, and addressing the issues pertaining to incomplete information using the LP paradigm. The proposed approach allows to identify in advance the causes that lead to adverse events, enabling the formulation of action plans to avoid or, at least, minimize them. The construction of a CT for a particular event is often time-consuming and difficult, because initially it requires the development of branches for each possible cause. However, after this stage is passed, the process of classification and analysis of adverse events becomes a speedier and easier exercise. A computation of the QoI enables the ranking of possible causes and the identification of the ones that should be prioritized. Consequently, in the construction of a CT, it is mandatory to look for all possible causes, not only the most probable or the usual ones.
The adverse event reporting and learning system presented allows knowledge extraction, i.e., the identification of the main failure causes, possible trends, areas requiring improvement plans, or changes in procedures. The automatic reports generated by the system are reliable. In fact, the quantification on-the-fly of the QoI of the logic terms used in the process of judgement (given in terms of a theorem to be proved) minimizes user participation, which is only necessary to approve the recommendations. One of the main advantages of the proposed system has to do with its modularity. This feature allows one to update the system at any time (e.g., add new categories, subcategories, and/or causal trees) without changing its structure or way of functioning.
Acknowledgements
Funding
This work has been supported by FCT – Fundação para a Ciência e Tecnologia within the R&D Units Project Scope UIDB/00319/2020 and UIDB/50006/2020.
Conflict of interest
None stated.
References
Notes
This presentation is faithful to the original, with only a few minor changes to presentation. Grammar was tweaked significantly to improve readability. The PMCID and DOI were also added when they were missing from the original reference. The original article lists references alphabetically, but this version—by design—lists them in order of appearance.
