Difference between revisions of "Journal:CytoConverter: A web-based tool to convert karyotypes to genomic coordinates"
Shawndouglas (talk | contribs) (Saving and adding more.) |
Shawndouglas (talk | contribs) (Saving and adding more.) |
||
| Line 81: | Line 81: | ||
===Multiple karyotype example=== | ===Multiple karyotype example=== | ||
We acquired karyotypes for 943 pediatric patients from the TARGET (“Therapeutically Applicable Research To Generate Effective Treatments”<ref name="MaPan18">{{cite journal |title=Pan-cancer genome and transcriptome analyses of 1,699 paediatric leukaemias and solid tumours |journal=Nature |author=Ma, X.; Liu, Y;. Liu, Y. et al. |volume=555 |issue=7696 |pages=371–76 |year=2018 |doi=10.1038/nature25795 |pmid=29489755 |pmc=PMC5854542}}</ref>) project. We uploaded a text, tab-delimited file (Additional file 2: Table S1) containing all 943 karyotypes to CytoConverter to automatically extract the implied gains and losses. CytoConverter’s tabular output is given in Additional file 3: Table S2. Recurrent duplication of chromosome 8 is apparent in CytoConverter’s graphical representation (Fig. 3). In general, it is expected the graphical output will be useful for visual detection of frequent loss or gain of specific chromosomal loci in associated samples. | We acquired karyotypes for 943 pediatric patients from the TARGET (“Therapeutically Applicable Research To Generate Effective Treatments”<ref name="MaPan18">{{cite journal |title=Pan-cancer genome and transcriptome analyses of 1,699 paediatric leukaemias and solid tumours |journal=Nature |author=Ma, X.; Liu, Y;. Liu, Y. et al. |volume=555 |issue=7696 |pages=371–76 |year=2018 |doi=10.1038/nature25795 |pmid=29489755 |pmc=PMC5854542}}</ref>) project. We uploaded a text, tab-delimited file (Additional file 2: Table S1) containing all 943 karyotypes to CytoConverter to automatically extract the implied gains and losses. CytoConverter’s tabular output is given in Additional file 3: Table S2. Recurrent duplication of chromosome 8 is apparent in CytoConverter’s graphical representation (Fig. 3). In general, it is expected the graphical output will be useful for visual detection of frequent loss or gain of specific chromosomal loci in associated samples. | ||
[[File:Fig3 Wang BMCBioinfo2019 20.png|1200px]] | |||
{{clear}} | |||
{| | |||
| STYLE="vertical-align:top;"| | |||
{| border="0" cellpadding="5" cellspacing="0" width="1200px" | |||
|- | |||
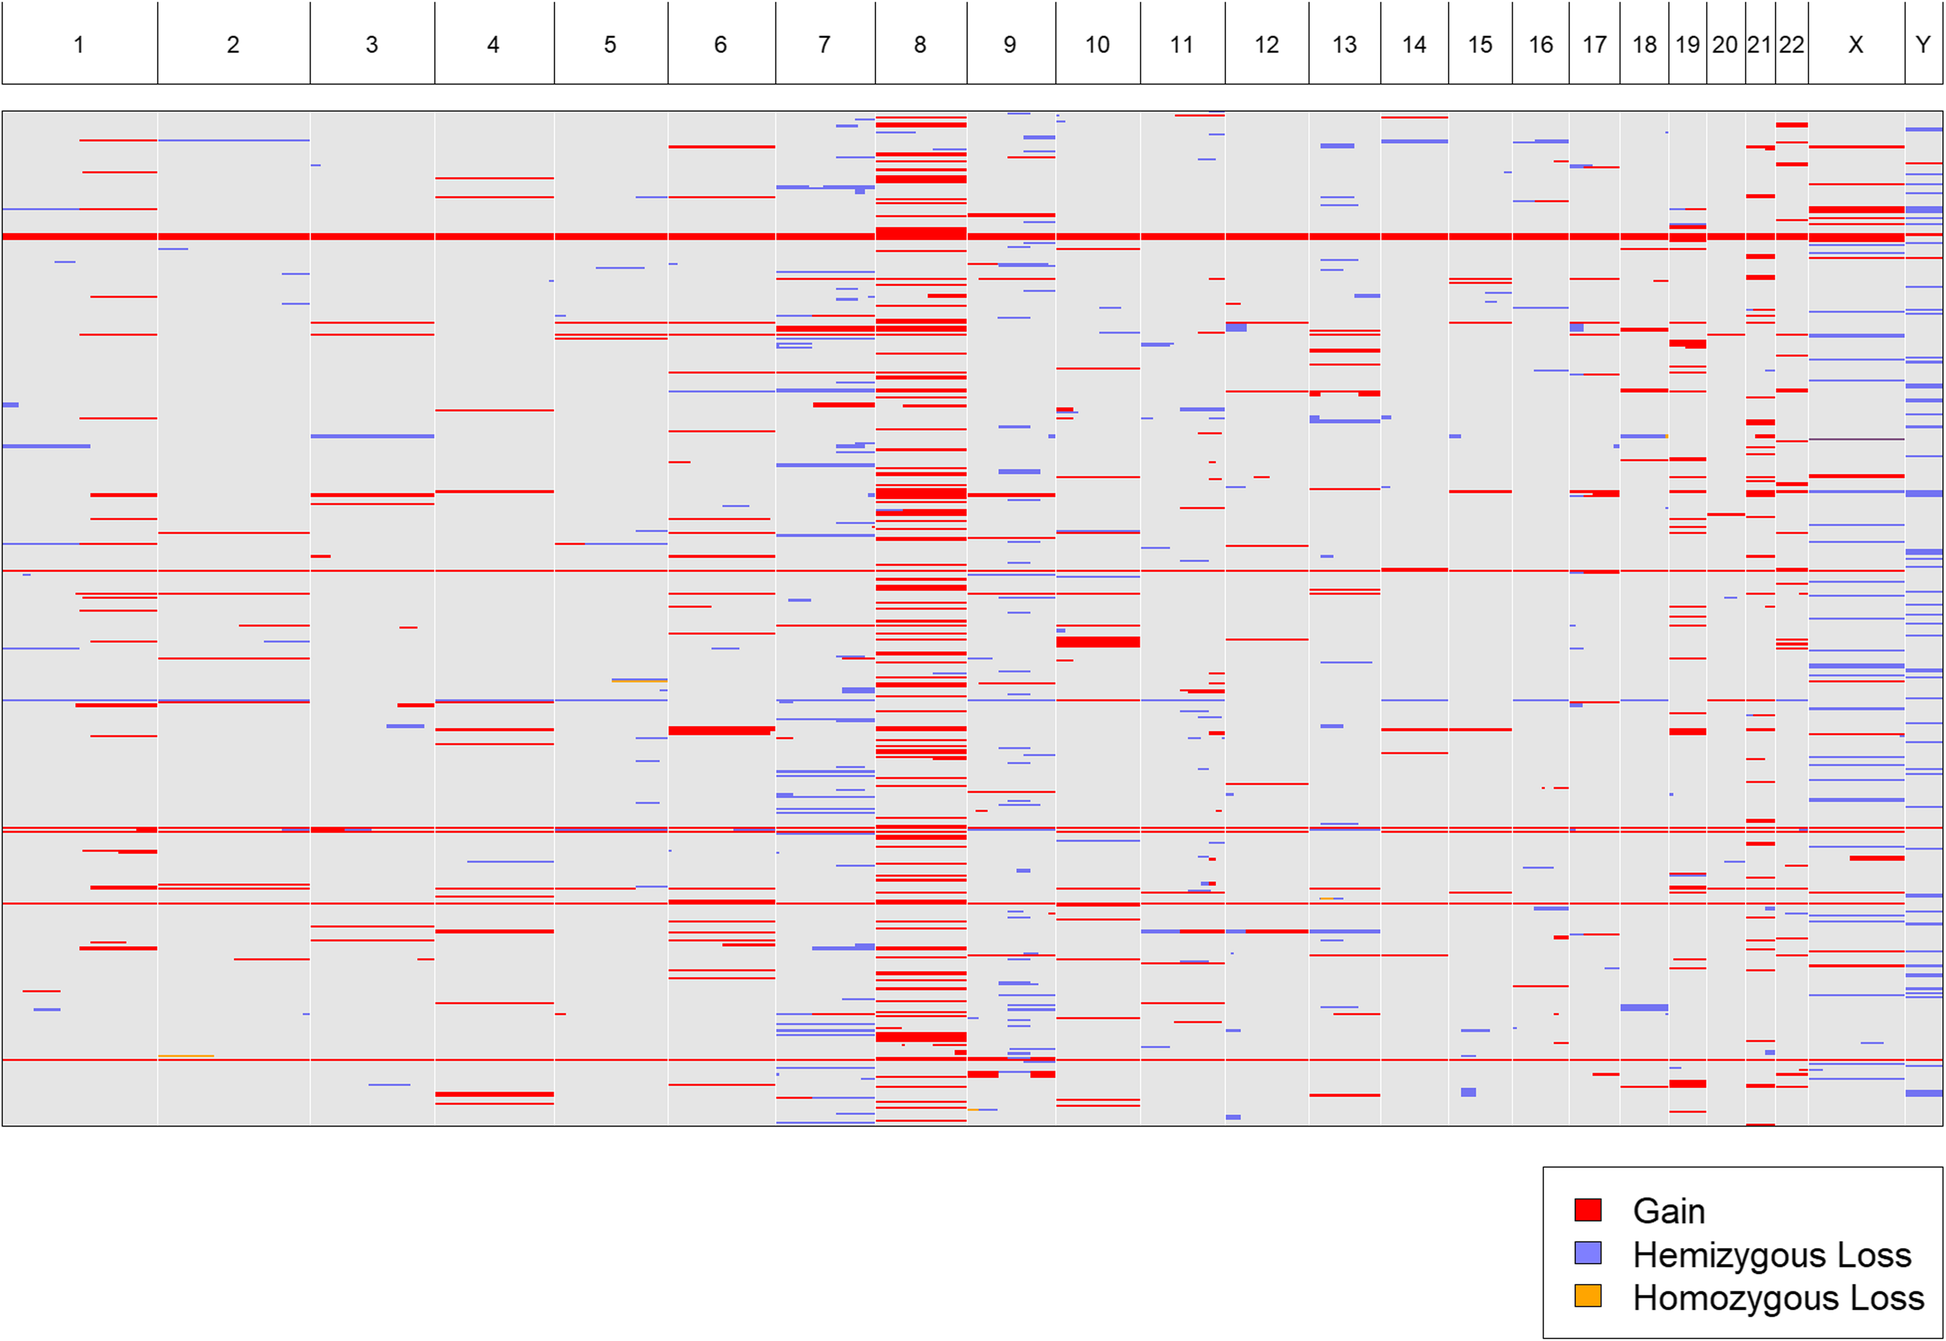
| style="background-color:white; padding-left:10px; padding-right:10px;"| <blockquote>'''Figure 3.''' Graphical output by CytoConverter derived from karyotypes of 943 patients from the TARGET consortium<ref name="MaPan18" /></blockquote> | |||
|- | |||
|} | |||
|} | |||
===Example involving multiple clones=== | |||
Standard cytogenetic nomenclature can accommodate samples with multiple distinct clones, each having a different karyotype. The nomenclature can also be used to indicate the number of visible cells corresponding to each clone karyotype. For example, 47,X,+X [30]/46,XX,+ 7,+ 9[50] indicates a sample with two clones, one with 30 visible cells harboring an extra copy of the X chromosome, and the other with 50 visible cells harboring extra copies of chromosomes 7 and 9. As noted above, CytoConverter handles multiple clones by appending “_n” to the sample name for its ''n''<sup>th</sup> clone’s karyotype. Table 1 gives example input for three patient samples, the last of which has the two-clone karyotype 47,X,+X [30]/46,XX,+ 7,+ 9[50]. CytoConverter’s tabular and graphical output are shown in Table 2 and Fig. 4, respectively. | |||
{| | |||
| STYLE="vertical-align:top;"| | |||
{| class="wikitable" border="1" cellpadding="5" cellspacing="0" width="100%" | |||
|- | |||
| style="background-color:white; padding-left:10px; padding-right:10px;" colspan="2"|'''Table 1.''' Example input to CytoConverter | |||
|- | |||
|- | |||
! style="background-color:#e2e2e2; padding-left:10px; padding-right:10px;"|Sample name | |||
! style="background-color:#e2e2e2; padding-left:10px; padding-right:10px;"|Karyotype | |||
|- | |||
| style="background-color:white; padding-left:10px; padding-right:10px;"|ABC | |||
| style="background-color:white; padding-left:10px; padding-right:10px;"|46,XY,der(1;19)(q10;p10) | |||
|- | |||
| style="background-color:white; padding-left:10px; padding-right:10px;"|DEF | |||
| style="background-color:white; padding-left:10px; padding-right:10px;"|47,XX,+der(10)t(10;21)(p13;q21) | |||
|- | |||
| style="background-color:white; padding-left:10px; padding-right:10px;"|P_10 | |||
| style="background-color:white; padding-left:10px; padding-right:10px;"|47,X,+X[30]/48,XX,+ 7,+ 9 [50] | |||
|- | |||
|} | |||
|} | |||
{| | |||
| STYLE="vertical-align:top;"| | |||
{| class="wikitable" border="1" cellpadding="5" cellspacing="0" width="100%" | |||
|- | |||
| style="background-color:white; padding-left:10px; padding-right:10px;" colspan="6"|'''Table 2.''' CytoConverter’s tabular output from input given in Table 1 | |||
|- | |||
|- | |||
! style="background-color:#e2e2e2; padding-left:10px; padding-right:10px;"|Sample ID | |||
! style="background-color:#e2e2e2; padding-left:10px; padding-right:10px;"|Chr | |||
! style="background-color:#e2e2e2; padding-left:10px; padding-right:10px;"|Start | |||
! style="background-color:#e2e2e2; padding-left:10px; padding-right:10px;"|End | |||
! style="background-color:#e2e2e2; padding-left:10px; padding-right:10px;"|Type | |||
! style="background-color:#e2e2e2; padding-left:10px; padding-right:10px;"|Cells present | |||
|- | |||
| style="background-color:white; padding-left:10px; padding-right:10px;"|ABC_1 | |||
| style="background-color:white; padding-left:10px; padding-right:10px;"|chr1 | |||
| style="background-color:white; padding-left:10px; padding-right:10px;"|0 | |||
| style="background-color:white; padding-left:10px; padding-right:10px;"|125,000,000 | |||
| style="background-color:white; padding-left:10px; padding-right:10px;"|Loss | |||
| style="background-color:white; padding-left:10px; padding-right:10px;"|unknown | |||
|- | |||
| style="background-color:white; padding-left:10px; padding-right:10px;"|ABC_1 | |||
| style="background-color:white; padding-left:10px; padding-right:10px;"|chr19 | |||
| style="background-color:white; padding-left:10px; padding-right:10px;"|26,500,000 | |||
| style="background-color:white; padding-left:10px; padding-right:10px;"|59,128,983 | |||
| style="background-color:white; padding-left:10px; padding-right:10px;"|Loss | |||
| style="background-color:white; padding-left:10px; padding-right:10px;"|unknown | |||
|- | |||
| style="background-color:white; padding-left:10px; padding-right:10px;"|DEF_1 | |||
| style="background-color:white; padding-left:10px; padding-right:10px;"|chr10 | |||
| style="background-color:white; padding-left:10px; padding-right:10px;"|12,200,000 | |||
| style="background-color:white; padding-left:10px; padding-right:10px;"|135,534,747 | |||
| style="background-color:white; padding-left:10px; padding-right:10px;"|Gain | |||
| style="background-color:white; padding-left:10px; padding-right:10px;"|unknown | |||
|- | |||
| style="background-color:white; padding-left:10px; padding-right:10px;"|DEF_1 | |||
| style="background-color:white; padding-left:10px; padding-right:10px;"|chr21 | |||
| style="background-color:white; padding-left:10px; padding-right:10px;"|16,400,000 | |||
| style="background-color:white; padding-left:10px; padding-right:10px;"|48,129,895 | |||
| style="background-color:white; padding-left:10px; padding-right:10px;"|Gain | |||
| style="background-color:white; padding-left:10px; padding-right:10px;"|unknown | |||
|- | |||
| style="background-color:white; padding-left:10px; padding-right:10px;"|P_10_1 | |||
| style="background-color:white; padding-left:10px; padding-right:10px;"|chrX | |||
| style="background-color:white; padding-left:10px; padding-right:10px;"|0 | |||
| style="background-color:white; padding-left:10px; padding-right:10px;"|155,270,560 | |||
| style="background-color:white; padding-left:10px; padding-right:10px;"|Gain | |||
| style="background-color:white; padding-left:10px; padding-right:10px;"|30 of 80 | |||
|- | |||
| style="background-color:white; padding-left:10px; padding-right:10px;"|P_10_2 | |||
| style="background-color:white; padding-left:10px; padding-right:10px;"|chr7 | |||
| style="background-color:white; padding-left:10px; padding-right:10px;"|0 | |||
| style="background-color:white; padding-left:10px; padding-right:10px;"|159,138,663 | |||
| style="background-color:white; padding-left:10px; padding-right:10px;"|Gain | |||
| style="background-color:white; padding-left:10px; padding-right:10px;"|50 of 80 | |||
|- | |||
| style="background-color:white; padding-left:10px; padding-right:10px;"|P_10_2 | |||
| style="background-color:white; padding-left:10px; padding-right:10px;"|chr9 | |||
| style="background-color:white; padding-left:10px; padding-right:10px;"|0 | |||
| style="background-color:white; padding-left:10px; padding-right:10px;"|141,213,431 | |||
| style="background-color:white; padding-left:10px; padding-right:10px;"|Gain | |||
| style="background-color:white; padding-left:10px; padding-right:10px;"|50 of 80 | |||
|- | |||
|} | |||
|} | |||
[[File:Fig4 Wang BMCBioinfo2019 20.png|900px]] | |||
{{clear}} | |||
{| | |||
| STYLE="vertical-align:top;"| | |||
{| border="0" cellpadding="5" cellspacing="0" width="900px" | |||
|- | |||
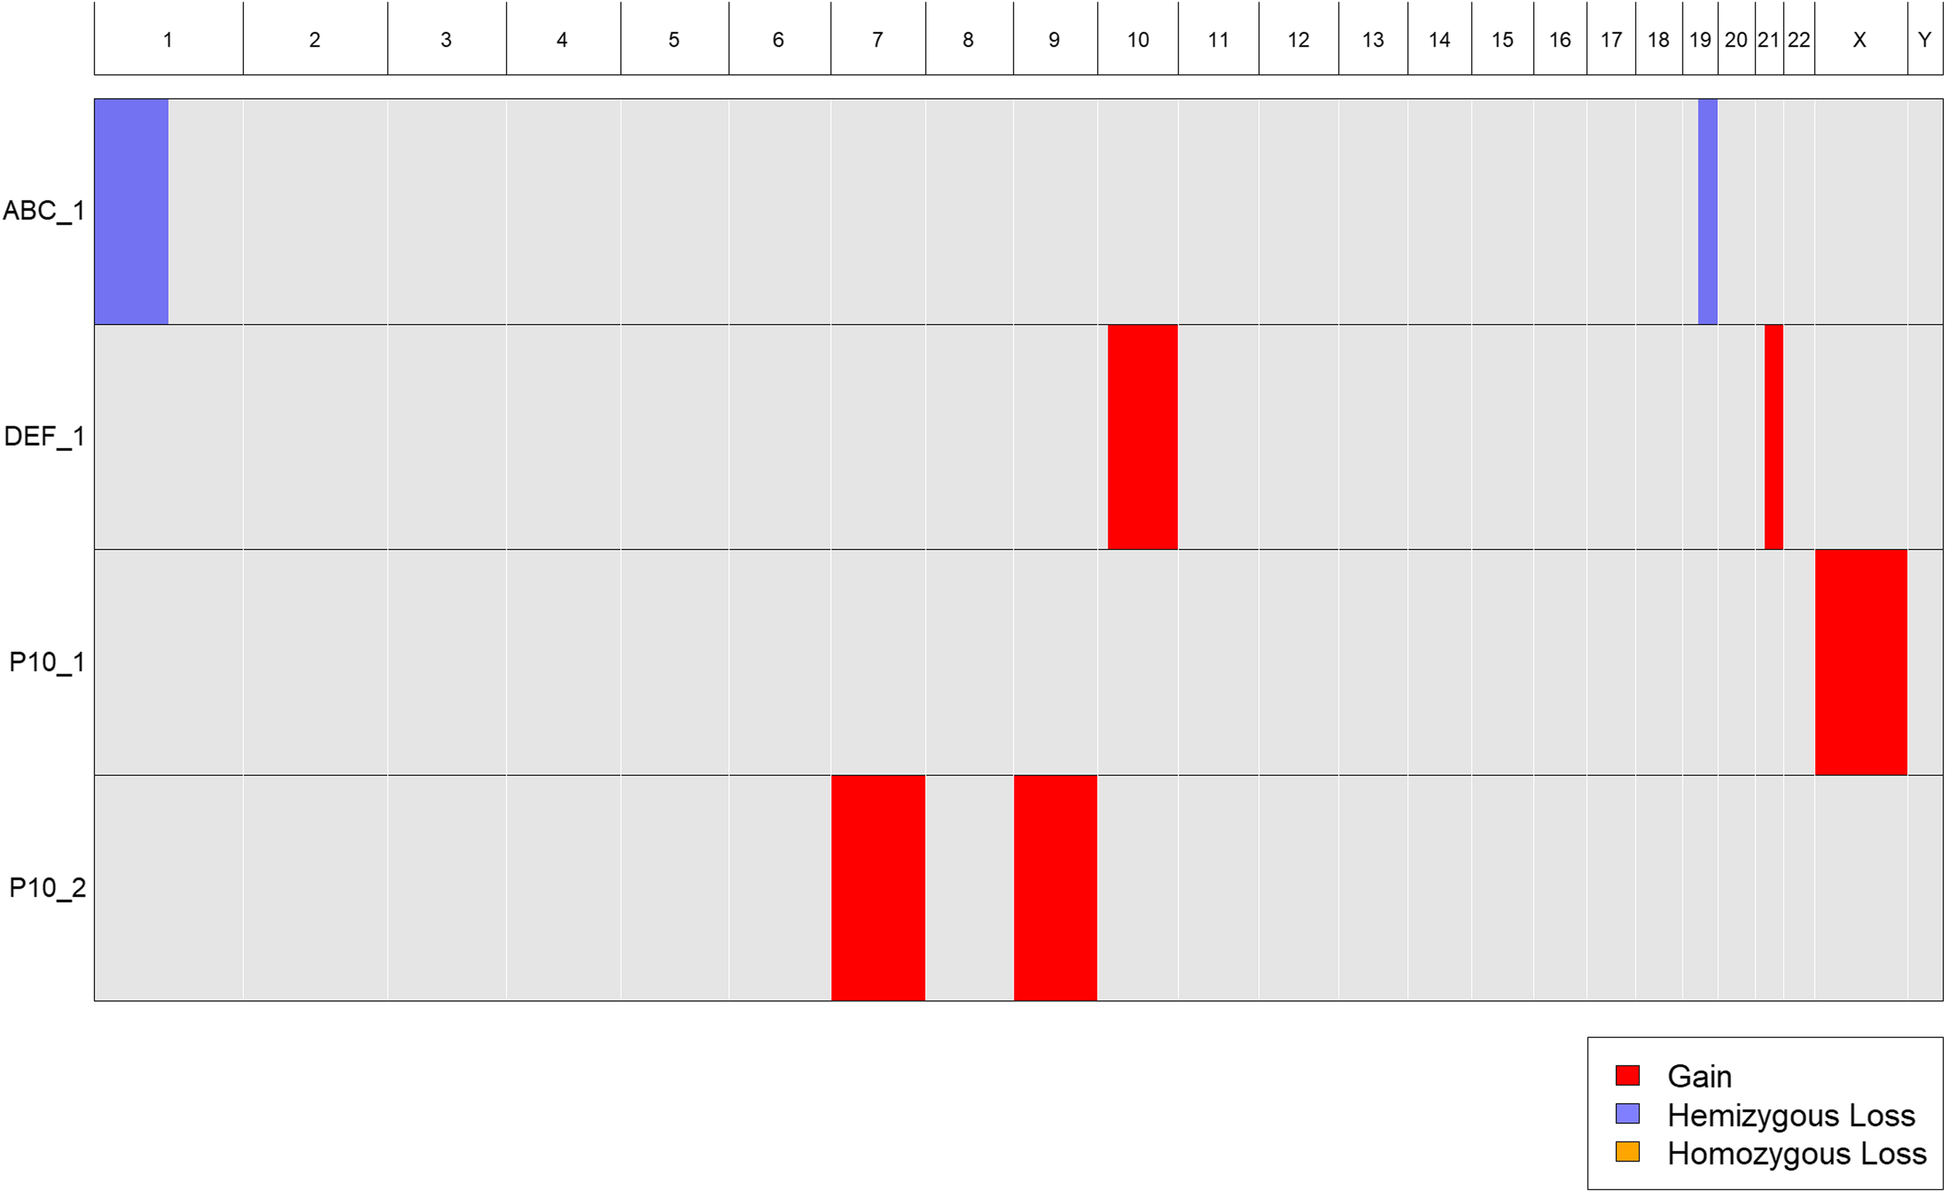
| style="background-color:white; padding-left:10px; padding-right:10px;"| <blockquote>'''Figure 4.''' CytoConverter’s graphical output from Table 1 input</blockquote> | |||
|- | |||
|} | |||
|} | |||
==Abbreviations== | ==Abbreviations== | ||
Revision as of 23:20, 16 December 2019
| Full article title | CytoConverter: A web-based tool to convert karyotypes to genomic coordinates |
|---|---|
| Journal | BMC Bioinformatics |
| Author(s) | Wang, Janet; LaFramboise, Thomas |
| Author affiliation(s) | Case Western Reserve University |
| Primary contact | Email: Thomas dot LaFramboise at case dot edu |
| Year published | 2019 |
| Volume and issue | 20 |
| Page(s) | 467 |
| DOI | [ https://doi.org/10.1186/s12859-019-3062-4 10.1186/s12859-019-3062-4] |
| ISSN | 1471-2105 |
| Distribution license | Creative Commons Attribution 4.0 International |
| Website | https://link.springer.com/article/10.1186/s12859-019-3062-4 |
| Download | https://link.springer.com/content/pdf/10.1186%2Fs12859-019-3062-4.pdf (PDF) |
|
|
This article should be considered a work in progress and incomplete. Consider this article incomplete until this notice is removed. |
Abstract
Background: Cytogenetic nomenclature is used to describe chromosomal aberrations (or lack thereof) in a collection of cells, referred to as the cells’ karyotype. The nomenclature identifies locations on chromosomes using a system of cytogenetic bands, each with a unique name and region on a chromosome. Each band is microscopically visible after staining, and it encompasses a large portion of the chromosome. More modern analyses employ genomic coordinates, which precisely specify a chromosomal location according to its distance from the end of the chromosome. Currently, there is no tool to convert cytogenetic nomenclature into genomic coordinates. Since locations of genes and other genomic features are usually specified by genomic coordinates, a conversion tool will facilitate the identification of the features that are harbored in the regions of chromosomal gain and loss that are implied by a karyotype.
Results: Our tool, termed CytoConverter, takes as input either a single karyotype or a file consisting of multiple karyotypes from several individuals. All net chromosomal gains and losses implied by the karyotype are returned in standard genomic coordinates, along with the numbers of cells harboring each aberration if included in the input. CytoConverter also returns graphical output detailing areas of gains and losses of chromosomes and chromosomal segments.
Conclusions: CytoConverter is available as a web-based application and as an R script. Supplemental Material detailing the underlying algorithms is available.
Keywords: cytogenetics, chromosomal abnormalities, karyotypes, text parsing
Background
Many human diseases, particularly cancer, are caused by or driven by gains and losses of chromosomes or chromosomal segments.[1] In cancer, oncogenes are often found within regions of gain, while tumor suppressor genes are frequently deleted.[2] Chromosomal abnormalities also cause many known syndromes, and may be suspected as causes of undiagnosed diseases.[3] As such, testing for gains and losses is an important component of both research and clinical practice.
Before the advent of higher-resolution techniques, karyotypes were the primary method used to characterize chromosomal aberrations, and they are still widely used. A karyotype summarizes the state of the genetic material in a collection of cells. The naming system for describing chromosomal changes—cytogenetic nomenclature—is dictated by the International System for Human Cytogenomic Nomenclature (ISCN).[4] It describes the total number of chromosomes in the cell, the unmodified sex chromosomes, and the chromosome(s) with abnormalities present. Karyotyping relies on the use of banding techniques, which have allowed researchers to describe the locations of microscopic-level changes such as translocations and band-sized or larger deletions and duplications. The completion of the human genome sequence in the early 2000s, however, enabled description of chromosomal aberrations in terms of genomic coordinates, which can specify locations at nucleotide-level resolution.[5] Technological advances such as genotyping microarrays (reviewed by LaFramboise in 2009[6]) and, more recently, next-generation sequencing (NGS) have spurred the community to more commonly frame deletions and gains in terms of genomic coordinates. However, karyotyping is still used today.[7] The use of cytogenetics remains popular for analyzing blood samples[8], for example. Additionally, there is copious archival data (e.g., the Mitelman Database of Chromosome Aberrations and Gene Fusions in Cancer) recorded in cytogenetic nomenclature. Large numbers of these karyotyped samples have not been subjected to microarray or NGS-based analyses, and in many cases the DNA is no longer available. In order to allow researchers to more easily identify the genomic entities such as genes and regulatory loci that are harbored in the gained and lost regions of karyotyped samples, we have developed a converter that parses the karyotypes and returns the corresponding gains and losses in terms of genomic coordinates.
A handful of tools are currently available to computationally analyze cytogenetic nomenclature. CyDAS[9] can characterize the loss and gain of chromosome material and can create karyograms from cytogenetic nomenclature. However, the program does not appear to have been updated since 2004, and it gives information using band locations, not genomic coordinates. The National Center for Biotechnology Information (NCBI) provides a tool to convert cytogenetic bands into genomic coordinates. However, this tool does not characterize losses and gains, and it only converts individual bands and not karyotypes.[10]
Implementation
CytoConverter is written in R. It accepts single karyotype strings and/or text, as well as tab-delimited tables, as input. An input table must have two columns, one indicating sample names and the other containing the karyotypes. The rules of cytogenetic nomenclature should be followed according to the ISCN 2016. CytoConverter outputs gains and losses, labelled by sample name, in hg18, hg19, or GRCh38 coordinates. If cell count information is provided in the input karyotype, CytoConverter also reports the numbers of cells harboring each aberration, and the total number of cells in the sample.
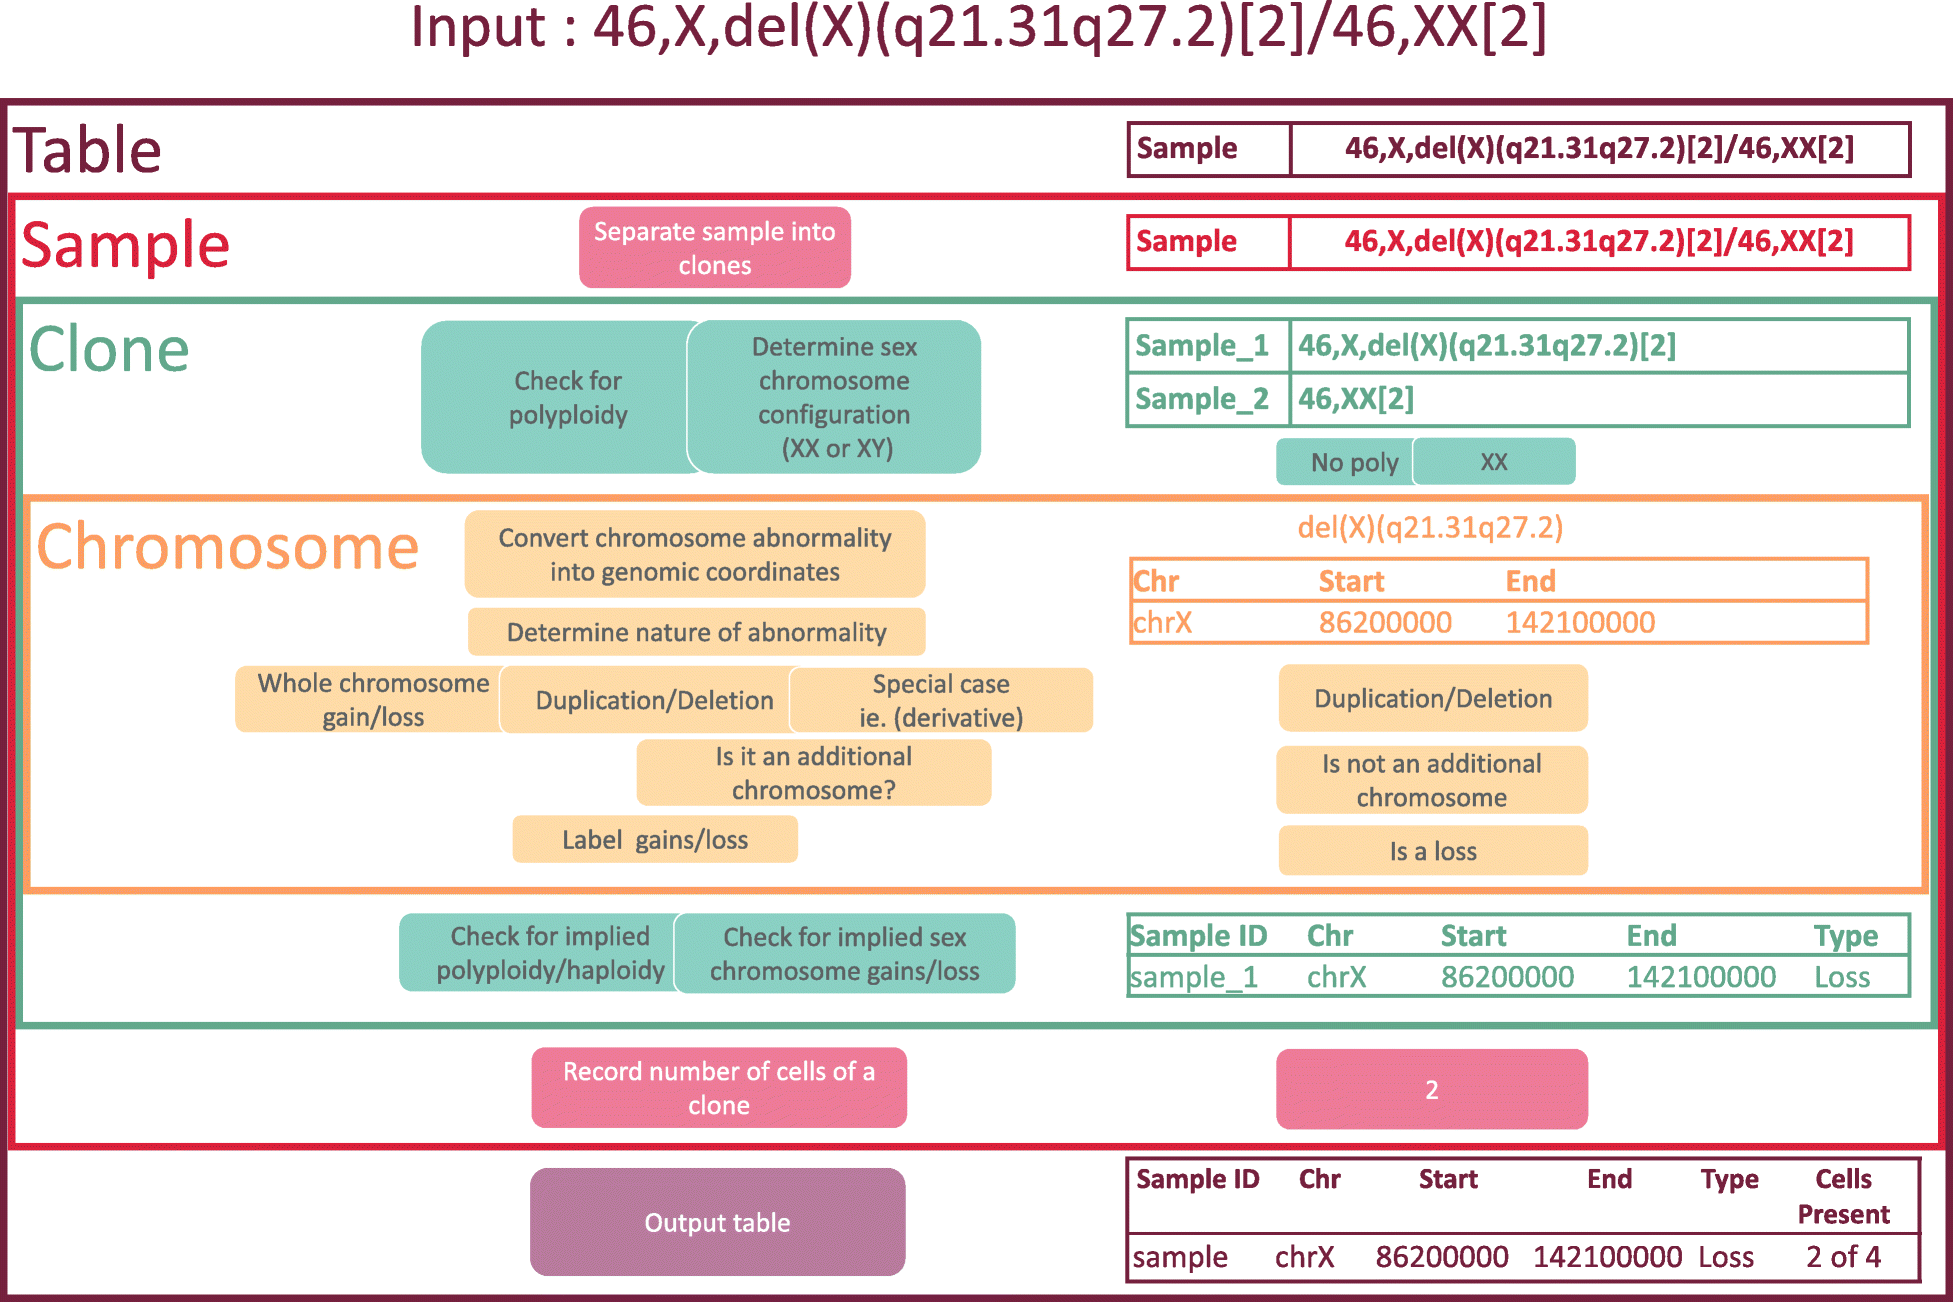
More specifically, CytoConverter divides a karyotype into individual clones, where applicable, reporting results according to each clone’s karyotype. It will output a table of losses and gains, with each row consisting of the sample name (adding “_n” to the sample name for the nth clone in the karyotype, if multiple clones are present), chromosome number, beginning base position, ending base position, whether the region was lost or gained, and number of cells in the clone out of total number of cells in the sample if cell number information is provided in the input karyotype. CytoConverter also provides graphical output displaying a heatmap in which rows represent distinct samples or clones and columns represent chromosomal locations. Gains are displayed in red, hemizygous losses in blue, and homozygous losses in yellow. An overview of the algorithm used to parse cytogenetic nomenclature is provided in Fig. 1.
|
CytoConverter uses the coordinates of cytobands as specified by the cytoband.txt file (resolution 850 bands, the maximum available) from the UCSC Genome Browser R/Builds folder. A web interface was created using Rshiny[11] , an R package used to build interactive web applications that run R in the background.
Results
Here we provide a set of examples demonstrating CytoConverter's capabilities.
Single karyotype example
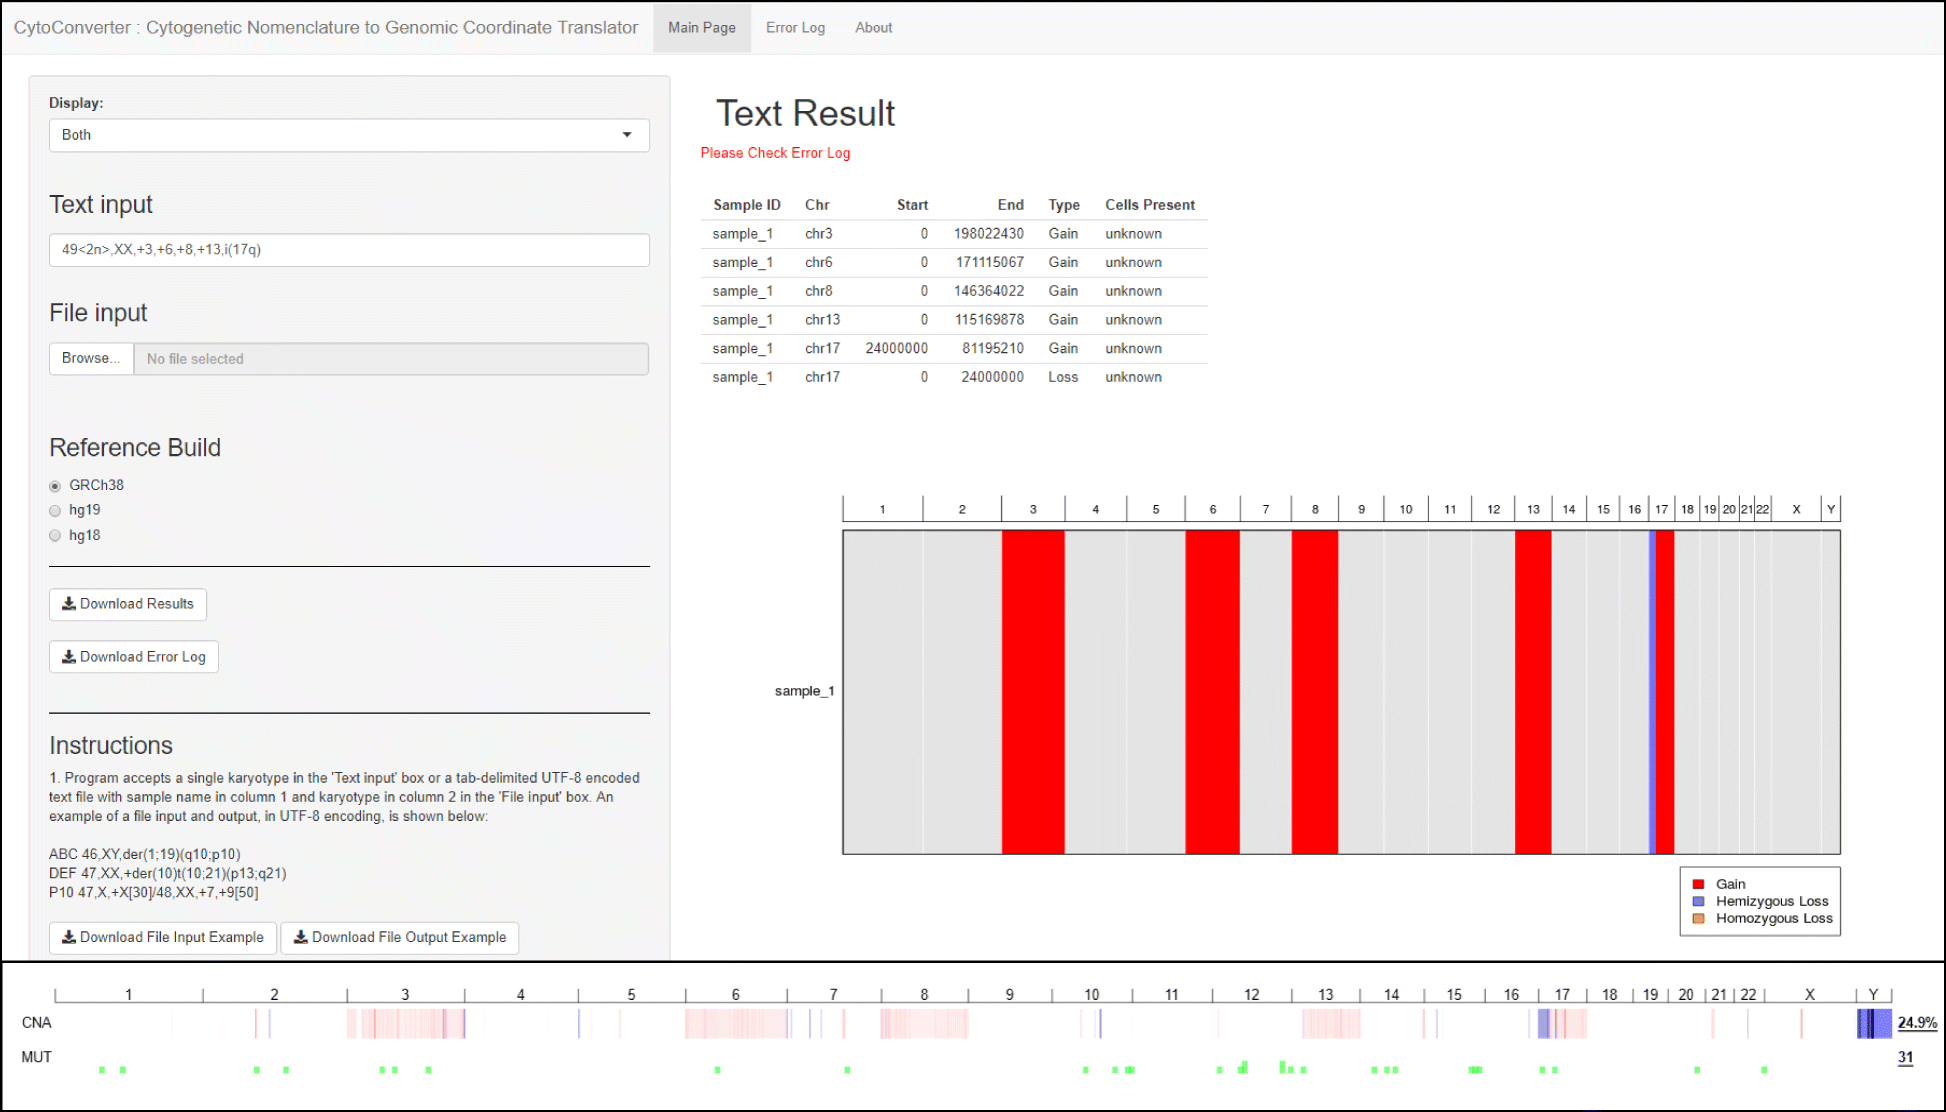
Figure 2 (top panel) shows an example of the interface and output of CytoConverter, applied to the karyotype of AML-193, a cell line derived from a female acute myeloid leukemia (AML) patient. The karyotype for AML-193 is given as 49 < 2n>,XX,+ 3,+ 6,+ 8,+ 13,i (17q) by the Leibniz Institute DSMZ- German Collection of Microorganisms and Cell Cultures.[12] As part of the Cancer Cell Line Encyclopedia[13], AML-193 was subjected to microarray-based copy number analysis, the results of which are shown in Fig. 2 (bottom panel). As shown, the copy number changes inferred by CytoConverter from the karyotype match well with the copy number lesions revealed from arrays, except for the more focal changes that are below the limited resolution available on the karyotype level. In this example, the number of cells present are not indicated in the karyotype, but CytoConverter is set up to accommodate complex karyotypes wherein different cells harbor different chromosomal aberrations (see below concerning multiple clones).
|
Multiple karyotype example
We acquired karyotypes for 943 pediatric patients from the TARGET (“Therapeutically Applicable Research To Generate Effective Treatments”[16]) project. We uploaded a text, tab-delimited file (Additional file 2: Table S1) containing all 943 karyotypes to CytoConverter to automatically extract the implied gains and losses. CytoConverter’s tabular output is given in Additional file 3: Table S2. Recurrent duplication of chromosome 8 is apparent in CytoConverter’s graphical representation (Fig. 3). In general, it is expected the graphical output will be useful for visual detection of frequent loss or gain of specific chromosomal loci in associated samples.
|
Example involving multiple clones
Standard cytogenetic nomenclature can accommodate samples with multiple distinct clones, each having a different karyotype. The nomenclature can also be used to indicate the number of visible cells corresponding to each clone karyotype. For example, 47,X,+X [30]/46,XX,+ 7,+ 9[50] indicates a sample with two clones, one with 30 visible cells harboring an extra copy of the X chromosome, and the other with 50 visible cells harboring extra copies of chromosomes 7 and 9. As noted above, CytoConverter handles multiple clones by appending “_n” to the sample name for its nth clone’s karyotype. Table 1 gives example input for three patient samples, the last of which has the two-clone karyotype 47,X,+X [30]/46,XX,+ 7,+ 9[50]. CytoConverter’s tabular and graphical output are shown in Table 2 and Fig. 4, respectively.
| ||||||||||
| ||||||||||||||||||||||||||||||||||||||||||||||||||||||
|
Abbreviations
AML: Acute myeloid leukemia
ISCN: International System for Human Cytogenomic Nomenclature
NCBI: National Center for Biotechnology Information
NGS: Next-generation sequencing
References
- ↑ Beroukhim, R.; Mermel, C.H.; Porter, D. et al. (2010). "The landscape of somatic copy-number alteration across human cancers". Nature 463 (7283): 899–905. doi:10.1038/nature08822. PMC PMC2826709. PMID 20164920. https://www.ncbi.nlm.nih.gov/pmc/articles/PMC2826709.
- ↑ Smith, J.C.; Sheltzer, J.M. (2018). "Systematic identification of mutations and copy number alterations associated with cancer patient prognosis". eLife 7: e39217. doi:10.7554/eLife.39217. PMC PMC6289580. PMID 30526857. https://www.ncbi.nlm.nih.gov/pmc/articles/PMC6289580.
- ↑ Theisen, A.; Shaffer, L.G. (2010). "Disorders caused by chromosome abnormalities". The Application of Clinical Genetics 3: 159–74. doi:10.2147/TACG.S8884. PMC PMC3681172. PMID 23776360. https://www.ncbi.nlm.nih.gov/pmc/articles/PMC3681172.
- ↑ McGowan-Jordan, J.; Simons, A.; Schmid, W., ed. (2016). ISCN 2016: An International System for Human Cytogenomic Nomenclature (2016). Karger International. ISBN 9783318058574.
- ↑ Naidoo, N.; Pawitan, T.; Soong, R. et al. (2011). "Human genetics and genomics a decade after the release of the draft sequence of the human genome". Human Genomics 5 (6): 577-622. doi:10.1186/1479-7364-5-6-577. PMC PMC3525251. PMID 22155605. https://www.ncbi.nlm.nih.gov/pmc/articles/PMC3525251.
- ↑ LaFramboise, T. (2009). "Single nucleotide polymorphism arrays: A decade of biological, computational and technological advances". Nucleic Acids Research 37 (13): 4181–93. doi:10.1093/nar/gkp552. PMC PMC2715261. PMID 19570852. https://www.ncbi.nlm.nih.gov/pmc/articles/PMC2715261.
- ↑ Li, S.; Garrett-Bakelman, F.E.; Chung, S.S. et al. (2016). "Distinct evolution and dynamics of epigenetic and genetic heterogeneity in acute myeloid leukemia". Nature Medicine 22 (7): 792–9. doi:10.1038/nm.4125. PMC PMC4938719. PMID 27322744. https://www.ncbi.nlm.nih.gov/pmc/articles/PMC4938719.
- ↑ Ferguson-Smith, M.A. (2015). "History and evolution of cytogenetics". Molecular Cytogenetics 8: 19. doi:10.1186/s13039-015-0125-8. PMC PMC4373004. PMID 25810762. https://www.ncbi.nlm.nih.gov/pmc/articles/PMC4373004.
- ↑ Hiller, B.; Bradtke, J.; Balz, H. et al. (2005). "CyDAS: A cytogenetic data analysis system". Bioinformatics 21 (7): 1283–3. doi:10.1093/bioinformatics/bti146. PMID 15546933.
- ↑ "BCS Help: Convert between sequence and cytogenetic coordinates". Bulk Sequence - Cytogenetic Conversion Service. National Center for Biotechnology Information. 10 July 2013. https://www.ncbi.nlm.nih.gov/genome/tools/cyto_convert/help/.
- ↑ Chang, W.; Cheng, J.; Allaire, J.J. et al. (2018). "shiny: Web Application Framework for R". R package version 1.1.0. https://rdrr.io/cran/shiny/.
- ↑ "AML-193". DSMZ-German Collection of Microorganism and Cell Cultures. Leibniz Institute. https://www.dsmz.de/collection/catalogue/details/culture/ACC-549.
- ↑ 13.0 13.1 Barretina, J.; Caponigro, G.; Stransky, N. et al. (2012). "The Cancer Cell Line Encyclopedia enables predictive modelling of anticancer drug sensitivity". Nature 483 (7391): 603–7. doi:10.1038/nature11003. PMC PMC3320027. PMID 22460905. https://www.ncbi.nlm.nih.gov/pmc/articles/PMC3320027.
- ↑ Cerami, E.; Gao, J.; Dogrusoz, U. et al. (2012). "The cBio cancer genomics portal: an open platform for exploring multidimensional cancer genomics data". Cancer Discovery 2 (5): 401–4. doi:10.1158/2159-8290.CD-12-0095. PMC PMC3956037. PMID 22588877. https://www.ncbi.nlm.nih.gov/pmc/articles/PMC3956037.
- ↑ Gao, J.; Aksov, B.A.; Dogrusoz, U. et al. (2013). "Integrative analysis of complex cancer genomics and clinical profiles using the cBioPortal". Science Signaling 6 (269): pl1. doi:10.1126/scisignal.2004088. PMC PMC4160307. PMID 23550210. https://www.ncbi.nlm.nih.gov/pmc/articles/PMC4160307.
- ↑ 16.0 16.1 Ma, X.; Liu, Y;. Liu, Y. et al. (2018). "Pan-cancer genome and transcriptome analyses of 1,699 paediatric leukaemias and solid tumours". Nature 555 (7696): 371–76. doi:10.1038/nature25795. PMC PMC5854542. PMID 29489755. https://www.ncbi.nlm.nih.gov/pmc/articles/PMC5854542.
Notes
This presentation is faithful to the original, with only a few minor changes to presentation, spelling, and grammar. We also added PMCID and DOI when they were missing from the original reference. The original article lists references alphabetically, but this version—by design—lists them in order of appearance.


