Journal:SUSHI: An exquisite recipe for fully documented, reproducible and reusable NGS data analysis
| Full article title | SUSHI: An exquisite recipe for fully documented, reproducible and reusable NGS data analysis |
|---|---|
| Journal | BMC Bioinformatics |
| Author(s) | Hatakeyama, Masaomi; Opitz, Lennart; Russo, Giancarlo; Qi, Weihong; Schlapbach, Ralph; Rehrauer, Hubert |
| Author affiliation(s) | ETH Zürich and University of Zürich |
| Primary contact | Email: hubert dot rehrauer at fgcz dot ethz dot ch |
| Year published | 2016 |
| Volume and issue | 17 |
| Page(s) | 228 |
| DOI | 10.1186/s12859-016-1104-8 |
| ISSN | 1471-2105 |
| Distribution license | Creative Commons Attribution 4.0 International |
| Website | http://bmcbioinformatics.biomedcentral.com/articles/10.1186/s12859-016-1104-8 |
| Download | http://bmcbioinformatics.biomedcentral.com/track/pdf/10.1186/s12859-016-1104-8 (PDF) |
|
|
This article should not be considered complete until this message box has been removed. This is a work in progress. |
Abstract
Background: Next generation sequencing (NGS) produces massive datasets consisting of billions of reads and up to thousands of samples. Subsequent bioinformatic analysis is typically done with the help of open-source tools, where each application performs a single step towards the final result. This situation leaves the bioinformaticians with the tasks of combining the tools, managing the data files and meta-information, documenting the analysis, and ensuring reproducibility.
Results: We present SUSHI, an agile data analysis framework that relieves bioinformaticians from the administrative challenges of their data analysis. SUSHI lets users build reproducible data analysis workflows from individual applications and manages the input data, the parameters, meta-information with user-driven semantics, and the job scripts. As distinguishing features, SUSHI provides an expert command line interface as well as a convenient web interface to run bioinformatics tools. SUSHI datasets are self-contained and self-documented on the file system. This makes them fully reproducible and ready to be shared. With the associated meta-information being formatted as plain text tables, the datasets can be readily further analyzed and interpreted outside SUSHI.
Conclusion: SUSHI provides an exquisite recipe for analysing NGS data. By following the SUSHI recipe, SUSHI makes data analysis straightforward and takes care of documentation and administration tasks. Thus, the user can fully dedicate his time to the analysis itself. SUSHI is suitable for use by bioinformaticians as well as life science researchers. It is targeted for, but by no means constrained to, NGS data analysis. Our SUSHI instance is in productive use and has served as data analysis interface for more than 1000 data analysis projects. SUSHI source code as well as a demo server are freely available.
Keywords: Data analysis framework, reproducible research, meta-level system design
Background
Today’s bioinformatics faces the practical challenge of analysing massive and diverse data in a well documented and reproducible fashion. The situation is particularly challenging in the area of NGS research where state-of-the-art algorithms are frequently available as standalone tools and where a complete data analysis consists of many individual data processing and analysis steps. The considerations associated with conducting such a data analysis in a research environment have been discussed by W. S. Noble[1], and guidelines as well as an example strategy for organizing computational data analysis have been given. According to Noble a key principle is to record every operation such that reproducibility is ensured.
In this paper, we present SUSHI, which stands for "Support Users for SHell-script Integration," a new approach to bioinformatics analysis that is centered on reusability, reproducibility and scalability. SUSHI produces analysis results as directories that are fully self-contained and hold all the information to be reproduced. Specifically, we document all parameters, input data, commands executed, as well as the versions of the tools and the reference data used. Additionally, we store meta-information on the experimental data together with the result files, so that those can be interpreted and further analyzed by other tools independently from SUSHI. This holds even if the analysis directory is transferred to collaborators with a different computing environment. SUSHI is extendable and we have put special emphasis on the simplicity of adding new software applications. A bioinformatician can define them within a single file and does not need special programming skills. SUSHI natively offers a command line interface as well as a web interface to run data analysis steps. Altogether, SUSHI lets bioinformaticians efficiently build analysis pipelines and ensures that analysis results are ready-to-be-shared and reproducible.
Various types of data analysis frameworks have already been implemented. They can be essentially divided into web-based frameworks and scripting frameworks. Examples for web-based frameworks are Galaxy[2], Chipster[3], GeneProf[4] or GenePattern.[5] They let users run individual steps or entire pipelines on a remote compute system with the framework keeping track of the executed analysis. Scripting frameworks like bpipe[6], Ruffus[7], nestly[8], NGSANE[9], Makeflow[10], and Snakemake[11] let users build bioinformatics pipelines in a command line fashion. Given the different types of user interactions, the former solutions are more targeted for the experienced biologists or the application-oriented bioinformaticians, while the latter address the needs of bioinformaticians who are more inclined to programming and high-throughput analysis of many datasets. However, there is no system as yet that natively offers both interfaces. Additionally, none of the existing frameworks puts an emphasis on having a human-readable and portable file-based representation of the meta-information and associated data.
Implementation
SUSHI data sets and applications
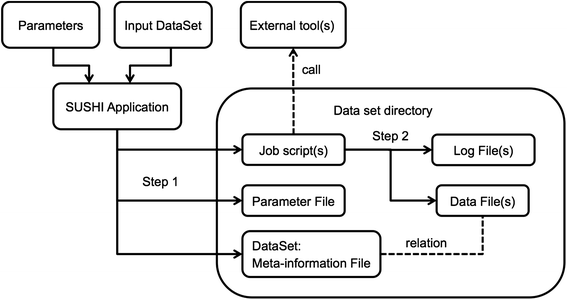
Within SUSHI, the original measured data as well as any derived analysis result is modeled as a data set that is represented as a fully self-sufficient directory on the file system. For the original data this means that it must be accompanied by meta-information on how the data has been measured. The meta-information must include information on the biological samples used as well as information on the measurement process. For analysis results this implies that the analysis result files must have accompanying meta-information that documents the input data, the analysis steps, and the analysis parameters. If these requirements are satisfied, we call this a "dataset." Figure 1 shows schematically how a dataset is generated as the result of running a SUSHI application. The meta-information associated with a dataset is represented in SUSHI as a DataSet object. On the file system a tabular file called "dataset.tsv" represents the dataset. Examples of meta-information are characteristics like sample name, species, tissue, but also e.g. the genome build that has been used for read alignment. Each characteristic is represented as a separate column in the tabular dataset.tsv.
|
A SUSHI application requires as input both a set of parameters and a DataSet object. This means that applications do not take bare data files as direct input. Instead, SUSHI applications take as input the DataSet meta-information object. The DataSet object holds, next to the data files, the meta-information necessary to process and interpret the data files. Based on its input, a SUSHI application first generates 1) the necessary job script(s), 2) a file representation of the parameters, and 3) the DataSet for the output data (Fig. 1 Step 1). The actual result data file(s) are generated by the job script(s) (Fig. 1 Step 2). The columns of the output DataSet hold again the meta-information, which now include additionally the parameters of the executed analysis if relevant for the further analysis or interpretation. The set of characteristics that is added to the annotation columns is defined and generated by the SUSHI application. The SUSHI framework itself does not require any specific annotation columns. Thus, the semantics of the DataSet columns are determined by the SUSHI applications (described in detail in the next section).
Every column of meta-information has a unique header that identifies the content and optional tags that characterize the information type in the column. Tags are represented as comma-separated strings within square brackets in the column headers. Currently supported tags are "File," "Link," "Factor," and "Characteristics." Depending on the tags, the SUSHI framework provides appropriate actions for the corresponding columns. The File tag is reserved for actual file paths, and SUSHI checks if the file actually exists. If a column has a Link tag, SUSHI will automatically add a hyperlink to the data. Finally, the Factor column data will be used to group samples according to experimental factors, which is typically required in a differential gene expression analysis.
Example DataSet holding RNA-seq reads
We follow the convention that sequencing read files are represented as a DataSet with the following columns:
- Name: the name of the sample measured
- Read1 [File]: path to the file holding the reads; if reads are paired-end, this must be the first read
- Adapter1: potentially contaminating adapter sequence at the 3′-end of read 1
- Read2 [File]: path to the second read for paired-end data (only for paired-end data)
- Adapter2: potentially contaminating adapter sequence at the 3′-end of read 2 (only for paired-end data)
- Species: the species of the sample
- StrandMode: specifies whether the library preparation protocol preserved strand information
- Enrichment Kit: the kit employed to enrich the input material (e.g. poly-A selection kit)
- Read Count: the number of reads in the file
Additionally, there can be columns that specify experimental factors. Table 1 shows an example (due to space constraints only a subset of the columns is shown).
| ||||||||||||||||||||||||
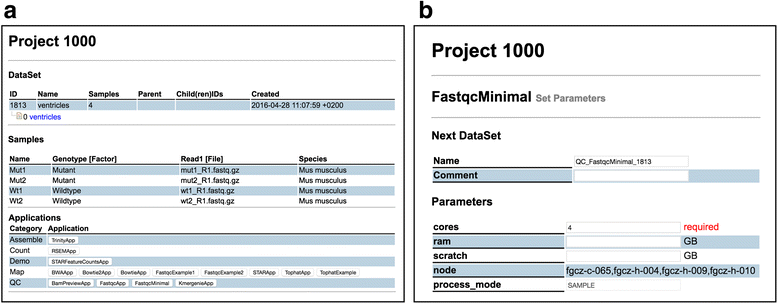
It is important to mention here that the SUSHI framework does not impose any constraints or semantics on the columns of the DataSet table. It is up to the user to identify which meta-information is relevant for his data. In particular, we do not require specific ontologies or controlled vocabularies. Users are free to define their own meta-information. The content definition and interpretation is entirely delegated to the user and the SUSHI applications. Figure 2a shows how the above DataSet is visualized in the SUSHI DataSet view.
|
Example SUSHI application performing a FastQC report
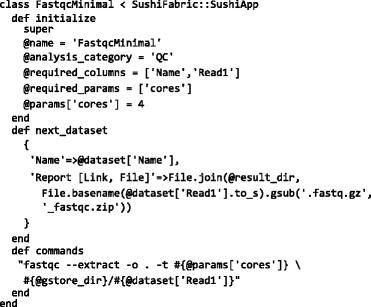
A common task is to generate a FastQC report[12] for each sample in a read data set. If the FastQC package is installed, one would run e.g. fastqc -o . -t 4 p1001/ventricles/mut1_R1.fastq.gz which creates the FastQC report mut1_R1_fastqc.zip for the first sample in the above data set. With the SUSHI framework this can be turned into a SUSHI application defined by the following Ruby code:
The example code shows the essential features of a SUSHI application (See also Additional file 1). The "@required_columns" tells the SUSHI framework which columns a DataSet must have so that "FastqcMinimal" is applicable. In Fig. 2a, all applications that are compatible with the example reads data set are shown at the bottom, including the "FastqcMinimal" application. The "@params['cores']" defines the number of cores to be used for multi-threading as a parameter with default value 4. This parameter is automatically turned into an input field in the web interface (see Fig. 2b. The code also defines with the method "next_dataset" the columns and content for the resulting DataSet. Finally, the method "commands" defines the command to be executed.
References
- ↑ Noble, W.S. (2009). "A quick guide to organizing computational biology projects". PLoS Computational Biology 5 (7): e1000424. doi:10.1371/journal.pcbi.1000424. PMC PMC2709440. PMID 19649301. https://www.ncbi.nlm.nih.gov/pmc/articles/PMC2709440.
- ↑ Goecks, Jeremey; Nekrutenko, Anton; Taylor, James; The Galaxy Team (2010). "Galaxy: a comprehensive approach for supporting accessible, reproducible, and transparent computational research in the life sciences". Genome Biology 11 (8): R86. doi:10.1186/gb-2010-11-8-r86. PMC PMC2945788. PMID 20738864. https://www.ncbi.nlm.nih.gov/pmc/articles/PMC2945788.
- ↑ Fisch, K.M.; Meißner, T.; Gioia, L. et al. (2015). "Omics Pipe: A community-based framework for reproducible multi-omics data analysis". Bioinformatics 31 (11): 1724-1728. doi:10.1093/bioinformatics/btv061. PMC PMC4443682. PMID 25637560. https://www.ncbi.nlm.nih.gov/pmc/articles/PMC4443682.
- ↑ Halbritter, F.; Vaidya, H.J.; Tomlinson, S.R. (2011). "GeneProf: Analysis of high-throughput sequencing experiments". Nature Methods 9 (1): 7–8. doi:10.1038/nmeth.1809. PMID 22205509.
- ↑ Reich, M.; Liefeld, T.; Gould, J. et al. (2006). "GenePattern 2.0". Nature Genetics 38 (5): 500–501. doi:10.1038/ng0506-500. PMID 16642009.
- ↑ Sadedin, S.P.; Pope, B.; Oshlack, A. (2012). "Bpipe: a tool for running and managing bioinformatics pipelines". Bioinformatics 28 (11): 1525-6. doi:10.1093/bioinformatics/bts167. PMID 22500002.
- ↑ Goodstadt, L. (2010). "Ruffus: A lightweight Python library for computational pipelines". Bioinformatics 26 (21): 2778-9. doi:10.1093/bioinformatics/btq524. PMID 20847218.
- ↑ McCoy, C.O.; Gallagher, A.; Hoffman, N.G.; Matsen, F.A. (2013). "nestly: A framework for running software with nested parameter choices and aggregating results". Bioinformatics 29 (3): 387–8. doi:10.1093/bioinformatics/bts696. PMC PMC3562064. PMID 23220574. https://www.ncbi.nlm.nih.gov/pmc/articles/PMC3562064.
- ↑ Buske, F.A.; French, H.J.; Smith, M.A. et al. (2014). "NGSANE: A lightweight production informatics framework for high-throuput data analysis". Bioinformatics 30 (10): 1471-1472. doi:10.1093/bioinformatics/btu036. PMC PMC4016703. PMID 24470576. https://www.ncbi.nlm.nih.gov/pmc/articles/PMC4016703.
- ↑ Yu, L.; Moretti, C.; Thrasher, A. et al. (2010). "Harnessing parallelism in multicore clusters with the All-Pairs, Wavefront, and Makeflow abstractions". Cluster Computing 13 (3): 243-256. doi:10.1007/s10586-010-0134-7.
- ↑ Köster, J.; Rahmann, S. (2012). "Snakemake: A scalable bioinformatics workflow engine". Bioinformatics 28 (19): 2520-2. doi:10.1093/bioinformatics/bts480. PMID 22908215.
- ↑ Andrews, S. (2010). "FastQC: A quality control tool for high throughput sequence date". Babraham Bioinformatics. Babraham Institute. http://www.bioinformatics.babraham.ac.uk/projects/fastqc/.
Notes
This presentation is faithful to the original, with only a few minor changes to presentation. In some cases important information was missing from the references, and that information was added.


