File:Fig1 Udesky EnviroHealth2019 18.png
Original file (638 × 782 pixels, file size: 120 KB, MIME type: image/png)
Summary
| Description |
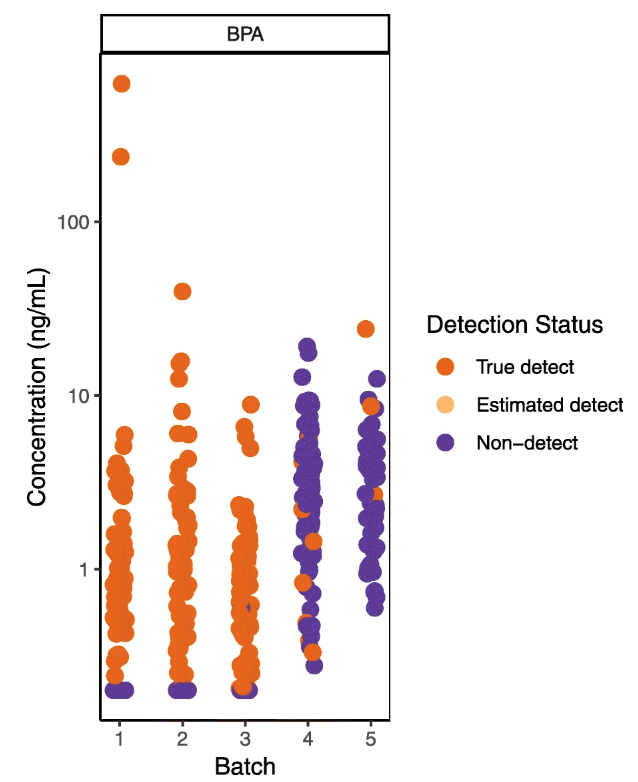
Figure 1. Visualizing urine sample results by analytical batch (data not yet published) revealed that sample-specific detection limits in later batches were higher and in the range of sample results in previous batches. After discussing with the laboratory, samples in later batches were re-analyzed to achieve lower detection limits. |
|---|---|
| Source |
Udesky, J.O.; Dodson, R.E.; Perovich, L.J.; Rudel, R.A. (2019). "Wrangling environmental exposure data: Guidance for getting the best information from your laboratory measurements". Environmental Health 18: 99. doi:10.1186/s12940-019-0537-8. |
| Date |
2019 |
| Author |
Udesky, J.O.; Dodson, R.E.; Perovich, L.J.; Rudel, R.A. |
| Permission (Reusing this file) |
|
| Other versions |
Licensing
|
|
This work is licensed under the Creative Commons Attribution 4.0 License. |
File history
Click on a date/time to view the file as it appeared at that time.
| Date/Time | Thumbnail | Dimensions | User | Comment | |
|---|---|---|---|---|---|
| current | 23:17, 13 April 2020 | | 638 × 782 (120 KB) | Shawndouglas (talk | contribs) |
You cannot overwrite this file.
File usage
The following 2 pages use this file:


