Journal:Big data in the era of health information exchanges: Challenges and opportunities for public health
| Full article title | Big data in the era of health information exchanges: Challenges and opportunities for public health |
|---|---|
| Journal | Informatics |
| Author(s) | Baseman, Janet G.; Revere, Debra; Painter, Ian |
| Author affiliation(s) | University of Washington |
| Primary contact | Email: jbaseman at uw dot edu |
| Editors | Ge, Mouzhi; Dohnal, Vlastislav |
| Year published | 2017 |
| Volume and issue | 4(4) |
| Page(s) | 39 |
| DOI | 10.3390/informatics4040039 |
| ISSN | 2227-9709 |
| Distribution license | Creative Commons Attribution 4.0 International |
| Website | http://www.mdpi.com/2227-9709/4/4/39/htm |
| Download | http://www.mdpi.com/2227-9709/4/4/39/pdf (PDF) |
Abstract
Public health surveillance of communicable diseases depends on timely, complete, accurate, and useful data that are collected across a number of health care and public health systems. Health information exchanges (HIEs) which support electronic sharing of data and information between health care organizations are recognized as a source of "big data" in health care and have the potential to provide public health with a single stream of data collated across disparate systems and sources. However, given these data are not collected specifically to meet public health objectives, it is unknown whether a public health agency’s (PHA’s) secondary use of the data is supportive of or presents additional barriers to meeting disease reporting and surveillance needs. To explore this issue, we conducted an assessment of big data that is available to a PHA—laboratory test results and clinician-generated notifiable condition report data—through its participation in an HIE.
Keywords: big data, communicable diseases, data mining, data quality, epidemiology, health information exchange, infectious diseases, population surveillance, public health
Introduction
We evaluated two datasets—for sexually-transmitted infections (STIs) and non-STIs—for the time period of January 1, 2012 to September 15, 2013 used by a PHA that is part of one of the largest and oldest HIE infrastructures in the U.S. The two datasets were independently analyzed for their data quality, utility, and appropriateness for meeting public health surveillance objectives: (1) timeliness, defined as the difference between earliest date of a disease report and date the report is received at the PHA; (2) volume, defined as the number of disease report cases received by the PHA; and (3) completion, defined as the number of days to close a disease case report.
Our assessment uncovered the following challenges for effective utilization of big data by public health:
- While PHAs almost exclusively rely on secondary use data for surveillance, big data that has been collected for clinical purposes omits data fields of high value for public health.
- Big data is not always smart data, especially when the context within which the data is collected is absent.
- Data collected by disparate, varying systems and sources can introduce uncertainties and limit trustworthiness in the data, which may diminish its value for public health purposes.
- The process by which data is obtained needs to be evident in order for big data to be useful to public health.
- Big data for public health purposes needs to answer both "what" and "why" questions.
Despite these and other issues—such as measurement error and confounding, well-known challenges to both big and small data—strategies traditionally employed by public health epidemiologists and other public health professionals can uncover limitations and contribute to the design of solutions in collection, integration, warehousing, and analysis of big data so its value and utility to public health can be optimized.
In recognition of the 10 year anniversary of the incorporation of the internet search firm Google, the journal Nature issued a special supplement on big data and what the availability of large datasets meant and will mean for scientists and researchers.[1] In particular, the supplement focused on the opportunities that will be possible when issues such as interoperable data infrastructures, security, data standardization, storage and transfer requirements, and data governance are resolved. Now, nearly 10 years later, users of big data—characterized by the 5 Vs (huge volume, high velocity, high variety, low veracity, and high value)—still encounter the issues presented in the Nature special supplement.[2] In particular, the primary challenges to utilizing big data center around the diversity of data types (variety), the resources required to handle data collection, storage and processing (velocity), and uncertainties inherent in mixing and cleaning data from varied data streams that generates unpredictability in the data (veracity).[3]
Nevertheless, within the health care sector, despite these challenges, big data also promises great opportunities to improve quality of health care delivery, population management, early detection of disease, decision-making, and cost reduction.[4] Major contributors to the explosion of big data are investments in information technology (IT), such as increased adoption of electronic medical record systems[5], and the creation of health information exchanges (HIEs)[6] which facilitate sharing of electronic data and information between health care organizations.[7] While the focus of HIEs has been on sharing patient information between clinics, hospitals, pharmacies, laboratories, and payers, public health agencies (PHAs) are increasingly included in HIEs.[8] PHA participation in a HIE provides a single stream of data collated across disparate systems and sources for public health.
Public health is a data-intensive and -driven field. Data is a highly valued currency for assessing the health of the community; providing guidance to stakeholders for handling a foodborne illness outbreak; forecasting the burden of seasonal influenza to enable sufficient timing to vaccinate vulnerable populations; and innumerable other efforts that aim to prevent disease, prolong life, promote human health, and mitigate unnecessary suffering.[9] Within the context of big data, public health efforts include linking information technology systems to conduct population-based cancer research and surveillance[10], more effectively identify behaviors that can build healthier communities[11], and improve targeted and timely epidemiologic surveillance of communicable and infectious disease.[12]
Specific to public health surveillance of communicable diseases, effective surveillance relies on time-sensitive, complete, accurate, and useful data that are collected across a number of healthcare and public health systems. It could be assumed that PHA participation in a HIE would support and potentially improve surveillance efforts, as data collected within the clinical encounter could be shared with public health more rapidly and be integrated into PHA decision support systems to meet public health practice needs. However, given that these data are not collected specifically to meet public health objectives, it is unknown whether a PHA’s secondary use of the data is supportive of or presents additional barriers to meeting disease reporting and surveillance needs. To explore this issue, we conducted an assessment of big data that is available to a PHA—laboratory test results and clinician-generated notifiable condition report data—through its participation in a HIE and discuss the extent to which its value impacts the rationale for investing in the infrastructure, including workforce training, that is required to collect and interpret this data and ultimately inform measurable improvements in the health of public health community stakeholders.
Objective
To explore challenges and opportunities for utilizing a public health big data available through PHA participation in a HIE.
Methods
Ethics
This study was approved by the Indiana University Institutional Review Board with cross-institutional and concurrent IRB deferral from the University of Washington.
Data source
Datasets for the time period of January 1, 2012 through September 15, 2013 were pulled from two public health surveillance systems: (1) the Statewide Information Management Surveillance System (SWIMSS), which collects electronic lab reports (ELRs) and communicable disease reports (CDRs) for STIs; and (2) InSight, the county’s core population health data system, which collects ELRs and CDRs of non-STI data for public health surveillance activities. The SWIMSS data pull was limited to the most prevalent and highly-reported conditions: chlamydia, gonorrhea, and syphilis. The InSight data pull was limited to acute hepatitis B, chronic hepatitis C, and salmonella.
Analysis
The two datasets were independently analyzed for their data quality, utility, and appropriateness for meeting public health surveillance objectives, including: (1) timeliness, defined as the difference between earliest date of a disease report and date the report is received at the PHA; (2) volume, defined as the number of disease report cases received by the PHA; and (3) completion, defined as the number of days until a case report is marked as closed by the investigator.
Each dataset was separately reviewed for data quality issues. Duplicate records were removed and missing data rates tabulated. Patterns of missing data over time were visualized over time and change point analysis[13] used to estimate time points at which underlying process changes may have occurred. Processing times (time to receipt of test results and PHA time to process results) were calculated in calendar days. Metadata was not available on which days the PHA conducted work, and this was estimated from the data based on days on which any cases were closed, and this estimated metadata was used to calculate number of work days required to close each case. Analyses of factors associated with time to receive and time to process cases were conducted after removal of atypical times. We aggregated case counts by disease and month to examine seasonal patterns of disease counts, and we aggregated case counts by disease and week to examine possible outbreaks and associations between outbreaks of different disease types. Occurrences of possible outbreaks were examined using a thresholds of three standard deviations above a 31-day moving average.
Results
The final SWIMSS dataset included chlamydia (n = 28018); gonorrhea (n = 7791); syphilis (n = 810); and syphilis, reactor (n = 3118). The final InSight dataset included acute hepatitis B (n = 563); chronic hepatitis C (n = 2160); histoplasmosis (n = 73); and salmonella (n = 210). Table 1 summarizes data exclusions resulting from the data quality analysis.
| |||||||||||||||||||||||||||||||||||||||||||||||||||||||||
We identified five specific challenges to secondary use of HIE data for meeting public health communicable disease surveillance needs. These challenges are illustrated by accompanying analyses.
Challenge 1
While PHAs almost exclusively rely on secondary use data for surveillance, big data that has been collected for clinical purposes omits data fields of high value for public health.
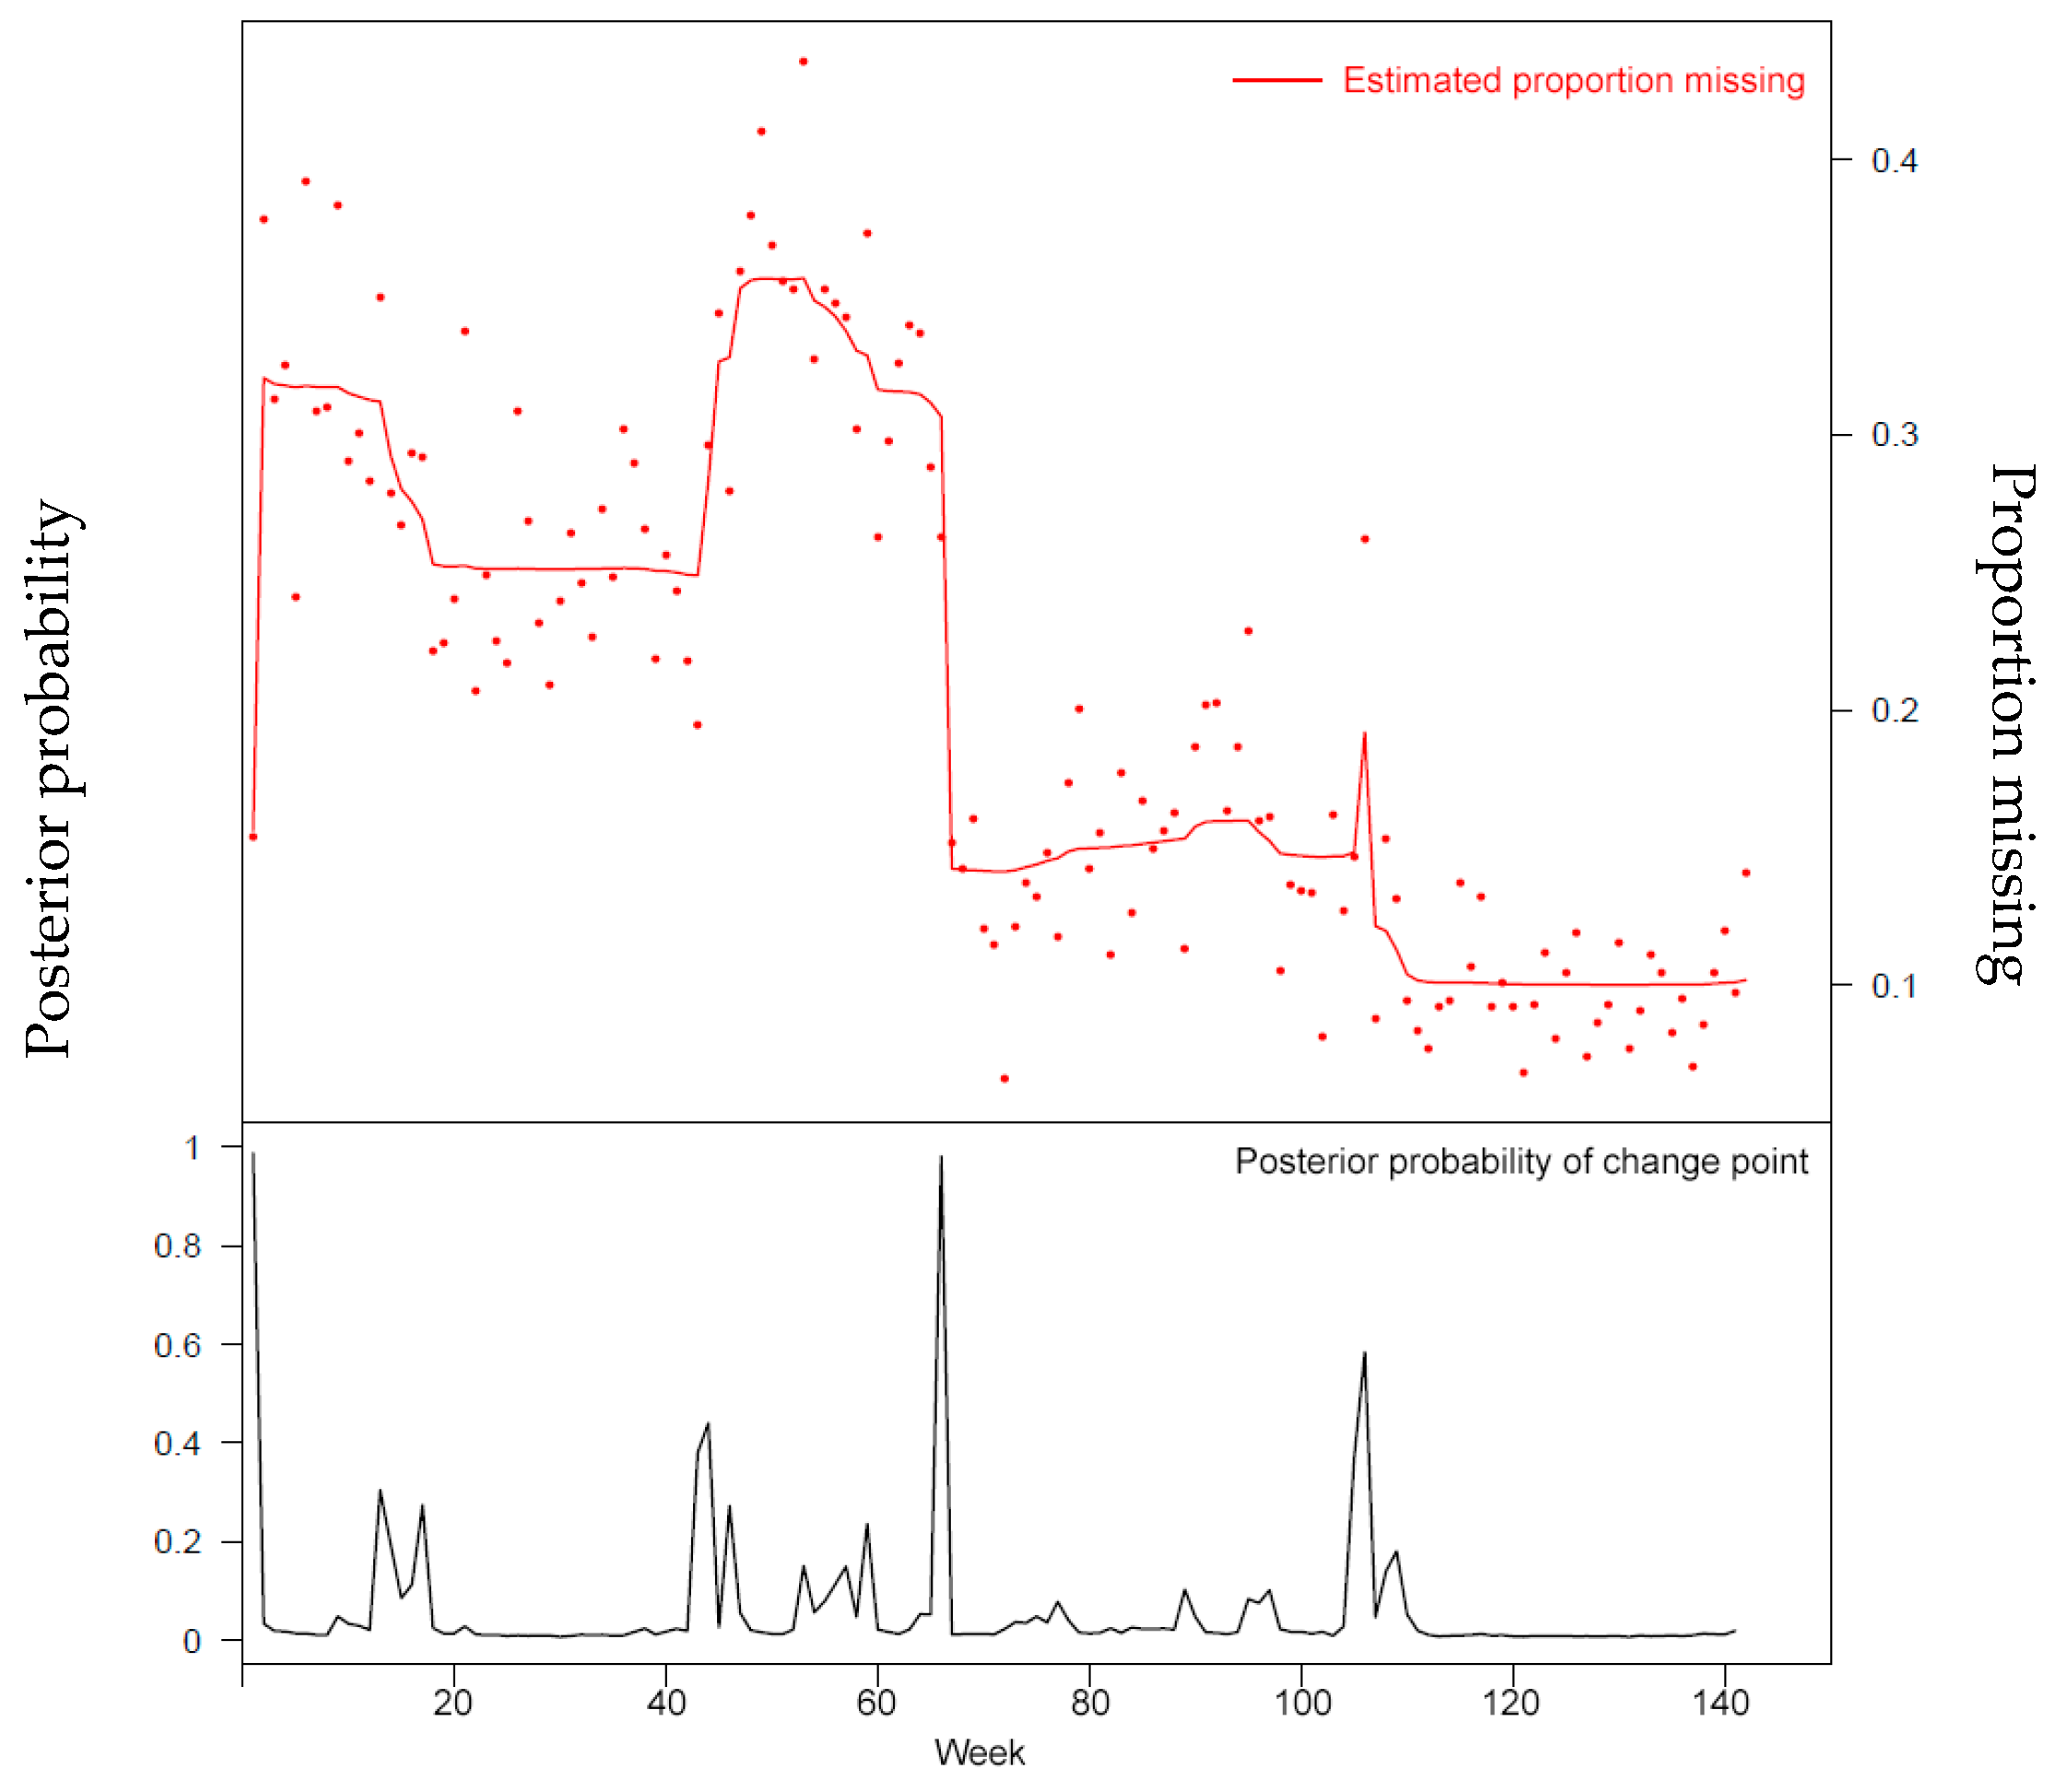
For example, demographic characteristics such as race/ethnicity are highly valued for understanding population level disparities in health and health care. Detailed spatial data (for example zip code level or finer) are data values for population-based forecasting and targeted development of health promotion materials and resource allocation but little used by clinicians; we observed lower data quality for these fields in our analysis. However, as seen in Figure 1, this information is not reliably collected, which can diminish the secondary use of this big data. This is observed in other population level databases; for example, ethnicity information in Medicare enrollment data has low sensitivity and specificity.[14]
|
Challenge 2
Big data is not always smart data, especially when the context within which the data is collected is absent. While big data is suitable for detecting an increase in volume of a particular variable of public health interest, it also presents classic, well-known outbreak detection problems such as unknown or fluctuating denominators (for example, where only positive test results are known and the underlying number of tests performed unknown) and signal-noise problems (for example, where early detection of outbreaks requires detecting low numbers of cases with non-specific symptoms from much larger volumes of health care encounters).
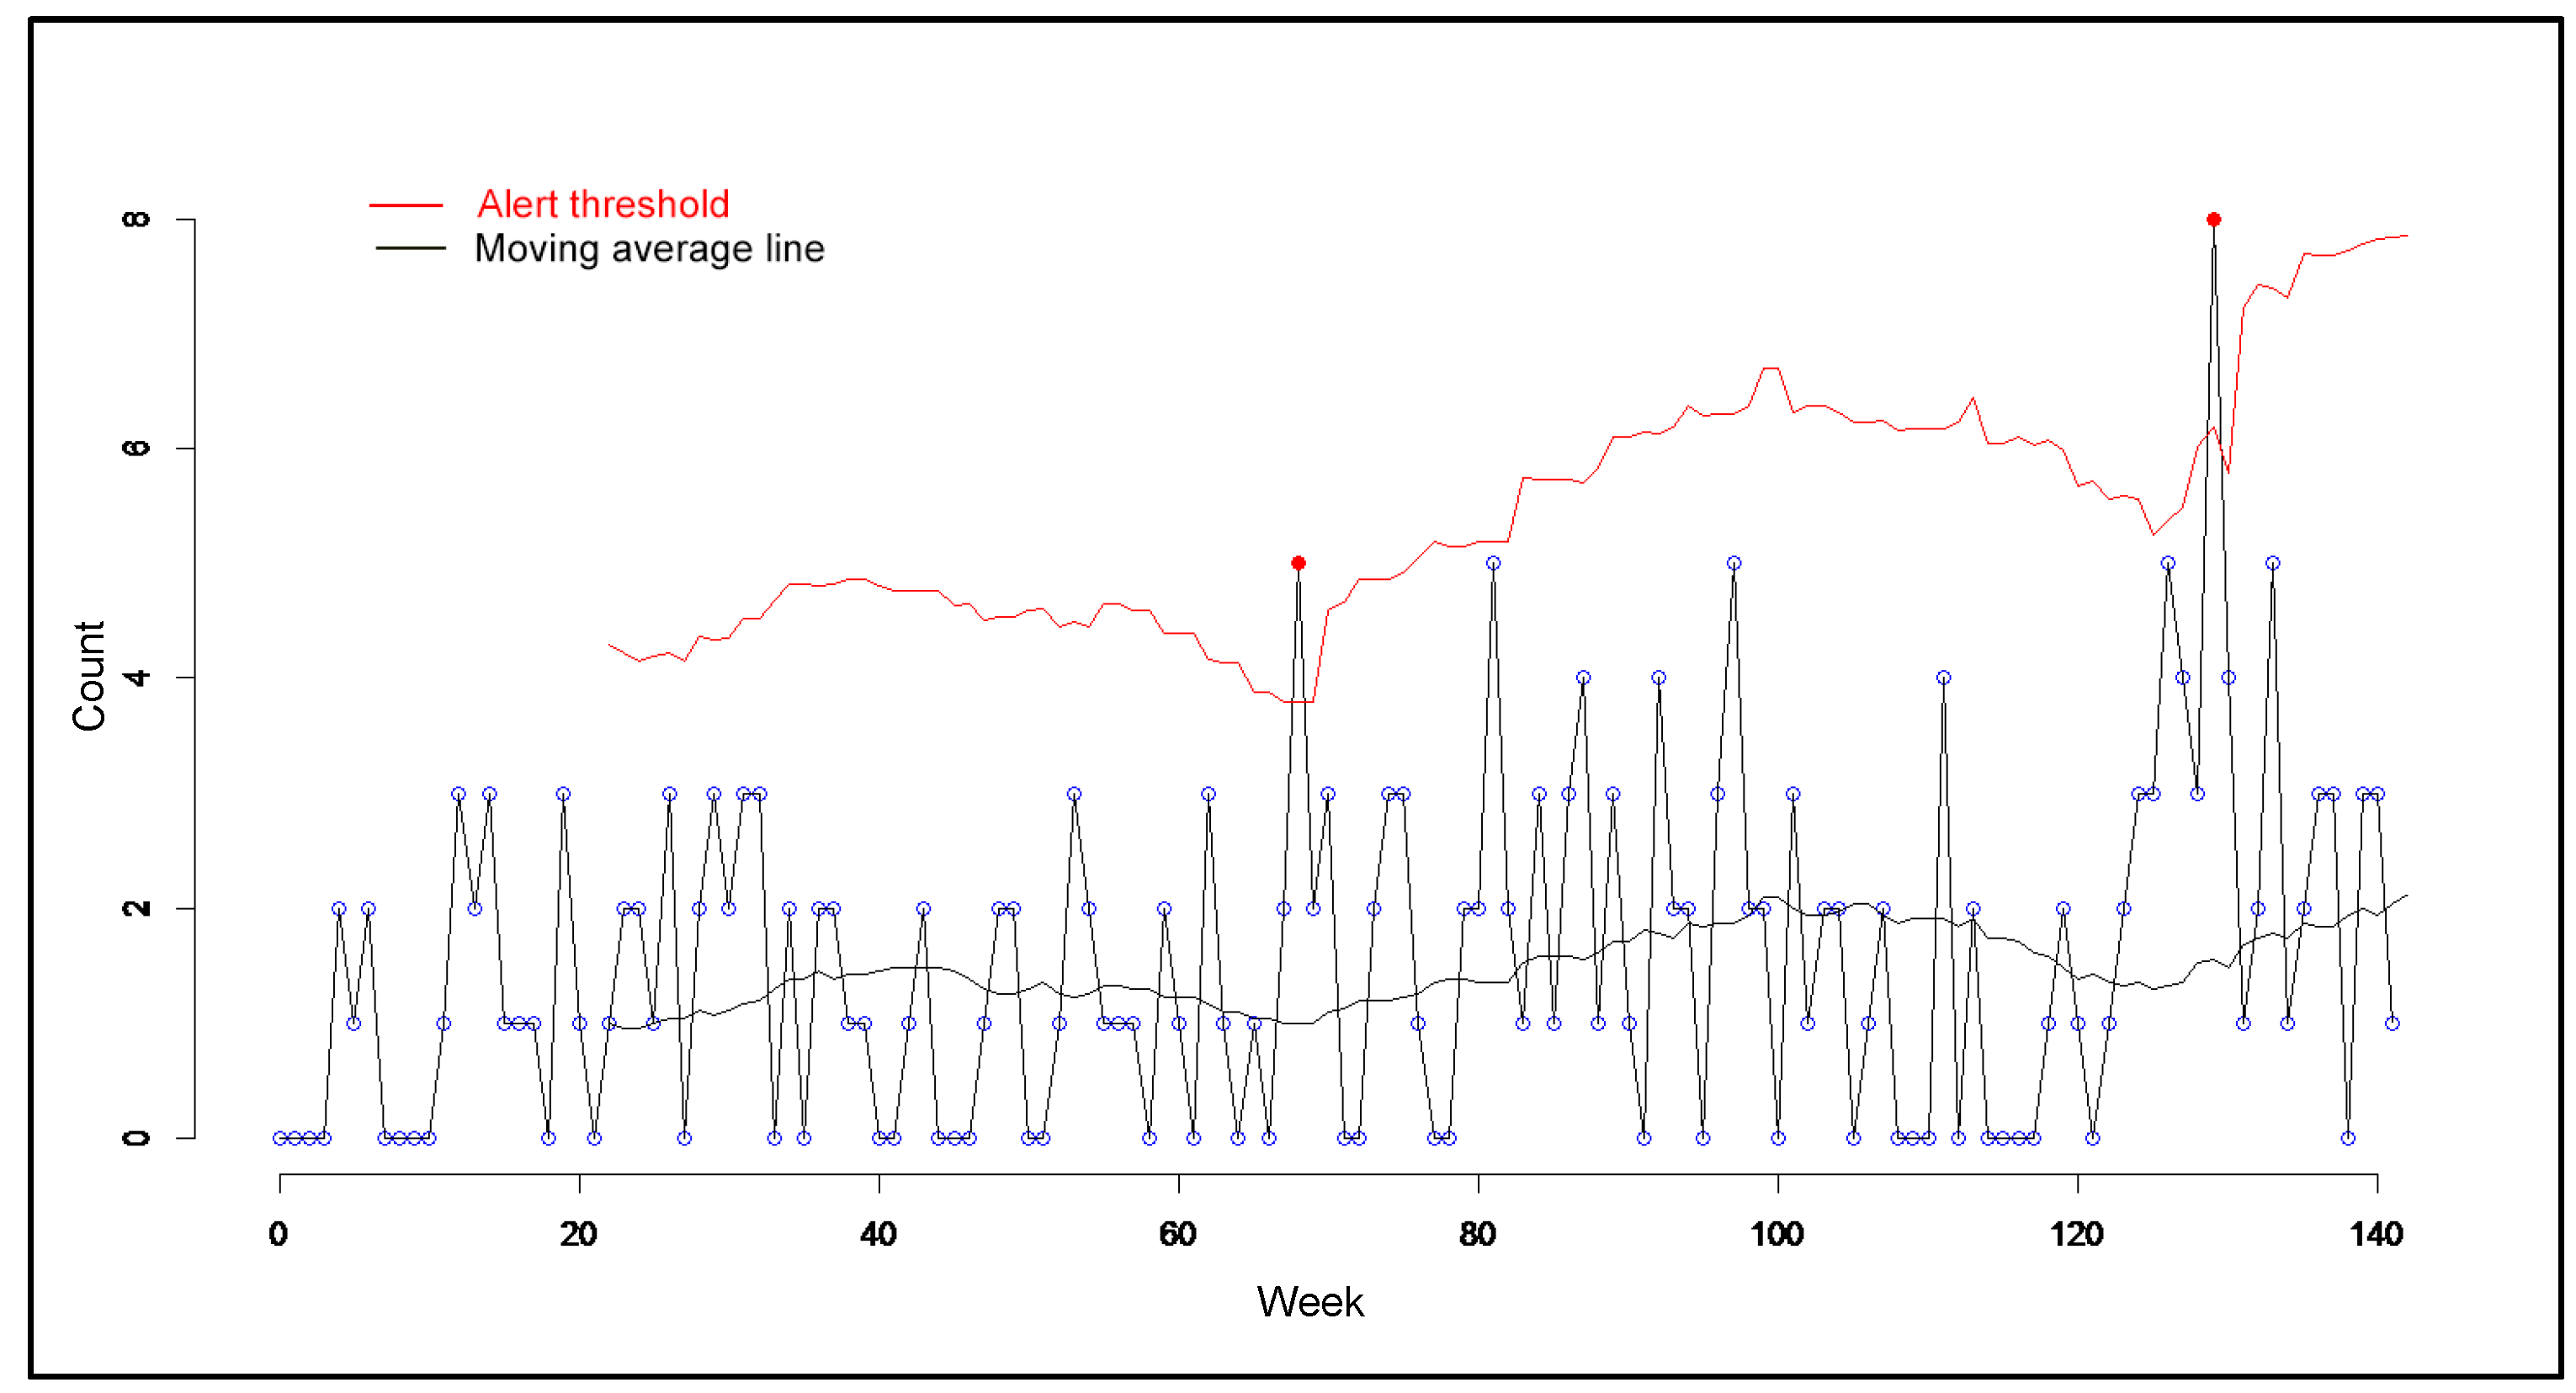
An illustration of this challenge is our observation in the data of an increase in the volume of salmonella cases (Figure 2). An initial interpretation would be that there is a probably salmonella outbreak. However, we learned that during the volume upticks, there was a shigella outbreak in the community. The observed increase then may be attributed to heightened clinical awareness and testing for any gastrointestinal illness symptoms, rather than a true increase in salmonella cases. Also, what appears to be an uptick may be understood to be the true prevalence of salmonella in the community and be interpreted as an indicator for low clinician reporting of a communicable disease.
|
Challenge 3
Data collected by disparate, varying systems and sources can introduce uncertainties and limit trustworthiness in the data, which may diminish its value for public health purposes.
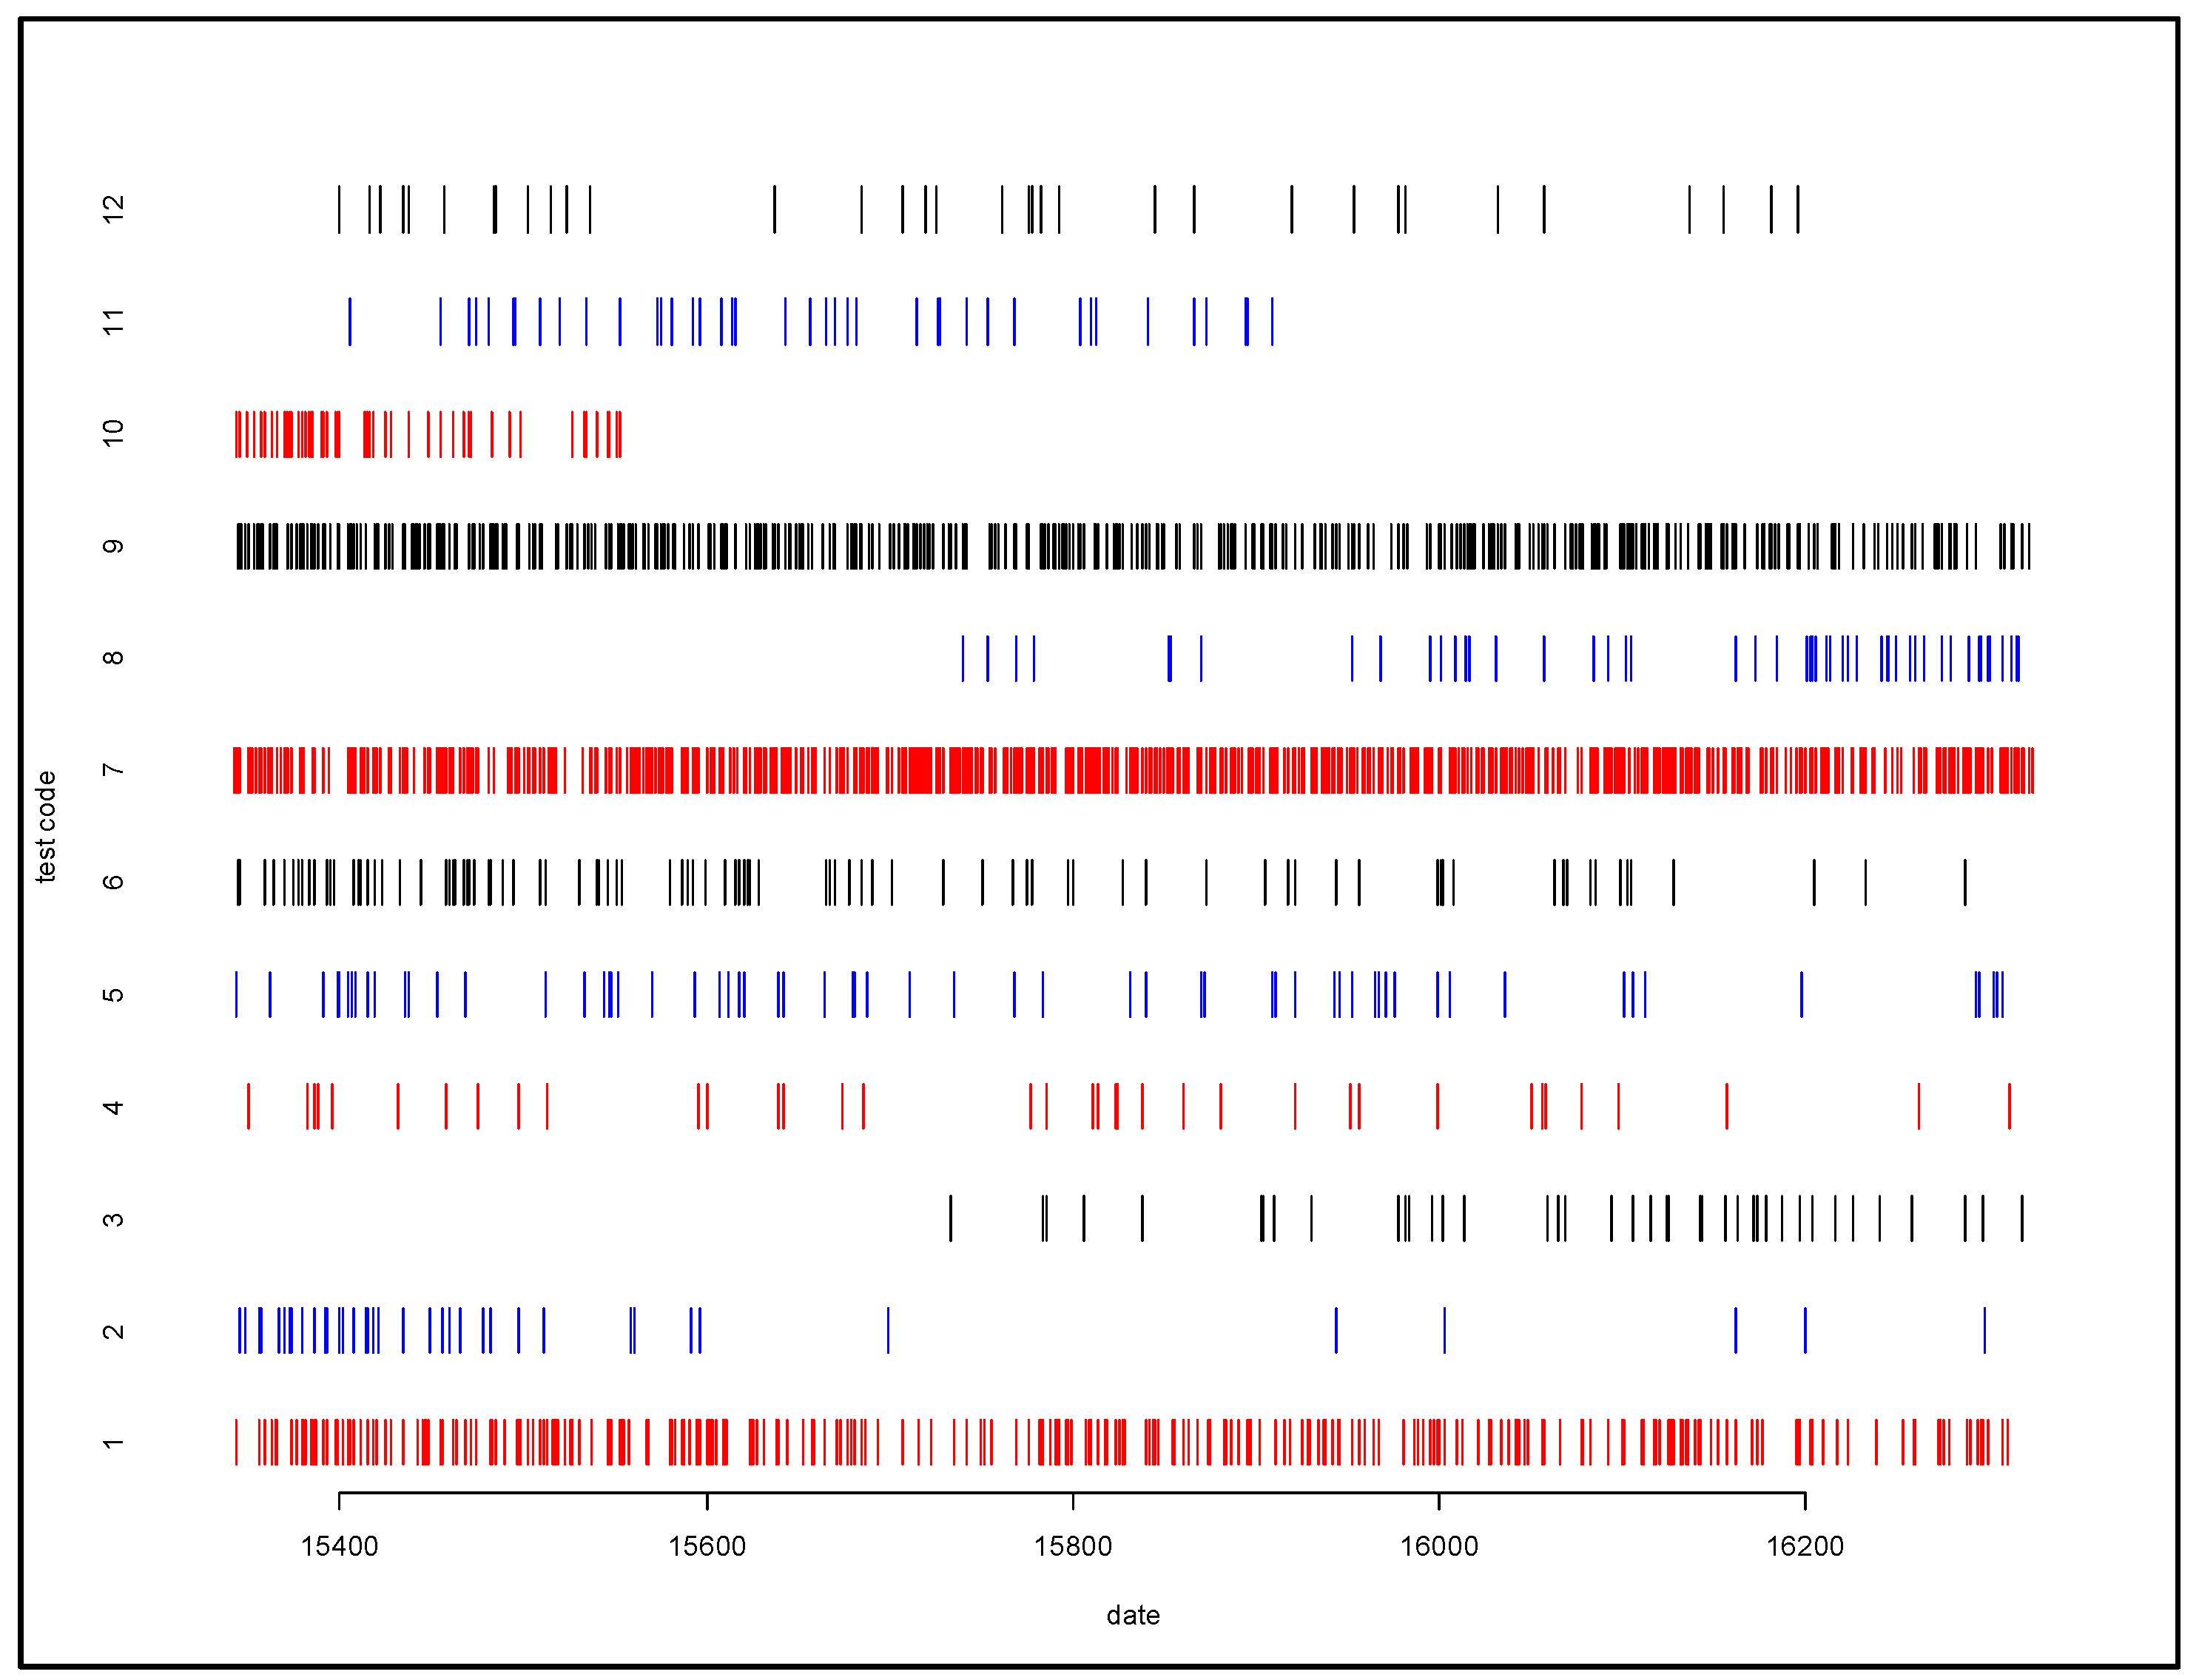
For example, in the case of laboratory reports, a positive lab test result can be generated by numerous different types of lab tests. A lab test reporting a positive case of acute hepatitis B can be due to any one of 22 different lab test codes, representing multiple types of lab tests. Chronic hepatitis B has 31 different lab test codes, while chronic hepatitis C has 48 different lab codes. We identified considerable variation in use over time for some tests (tests 2, 3, 8, 10, and 11) as illustrated in Figure 3. Different lab tests may have different sensitivity and specificity characteristics, and so changes in lab test composition over time complicate interpretation of trends.
|
Challenge 4
The process by which data is obtained needs to be evident in order for big data to be useful to public health. Changes in the data generation and collection processes that underlay testing for disease and collection of test data can have big impacts on value of data for public health (examples could include changes in the type of test used at a facility or changes in personal resulting in changing patterns of coding usage).
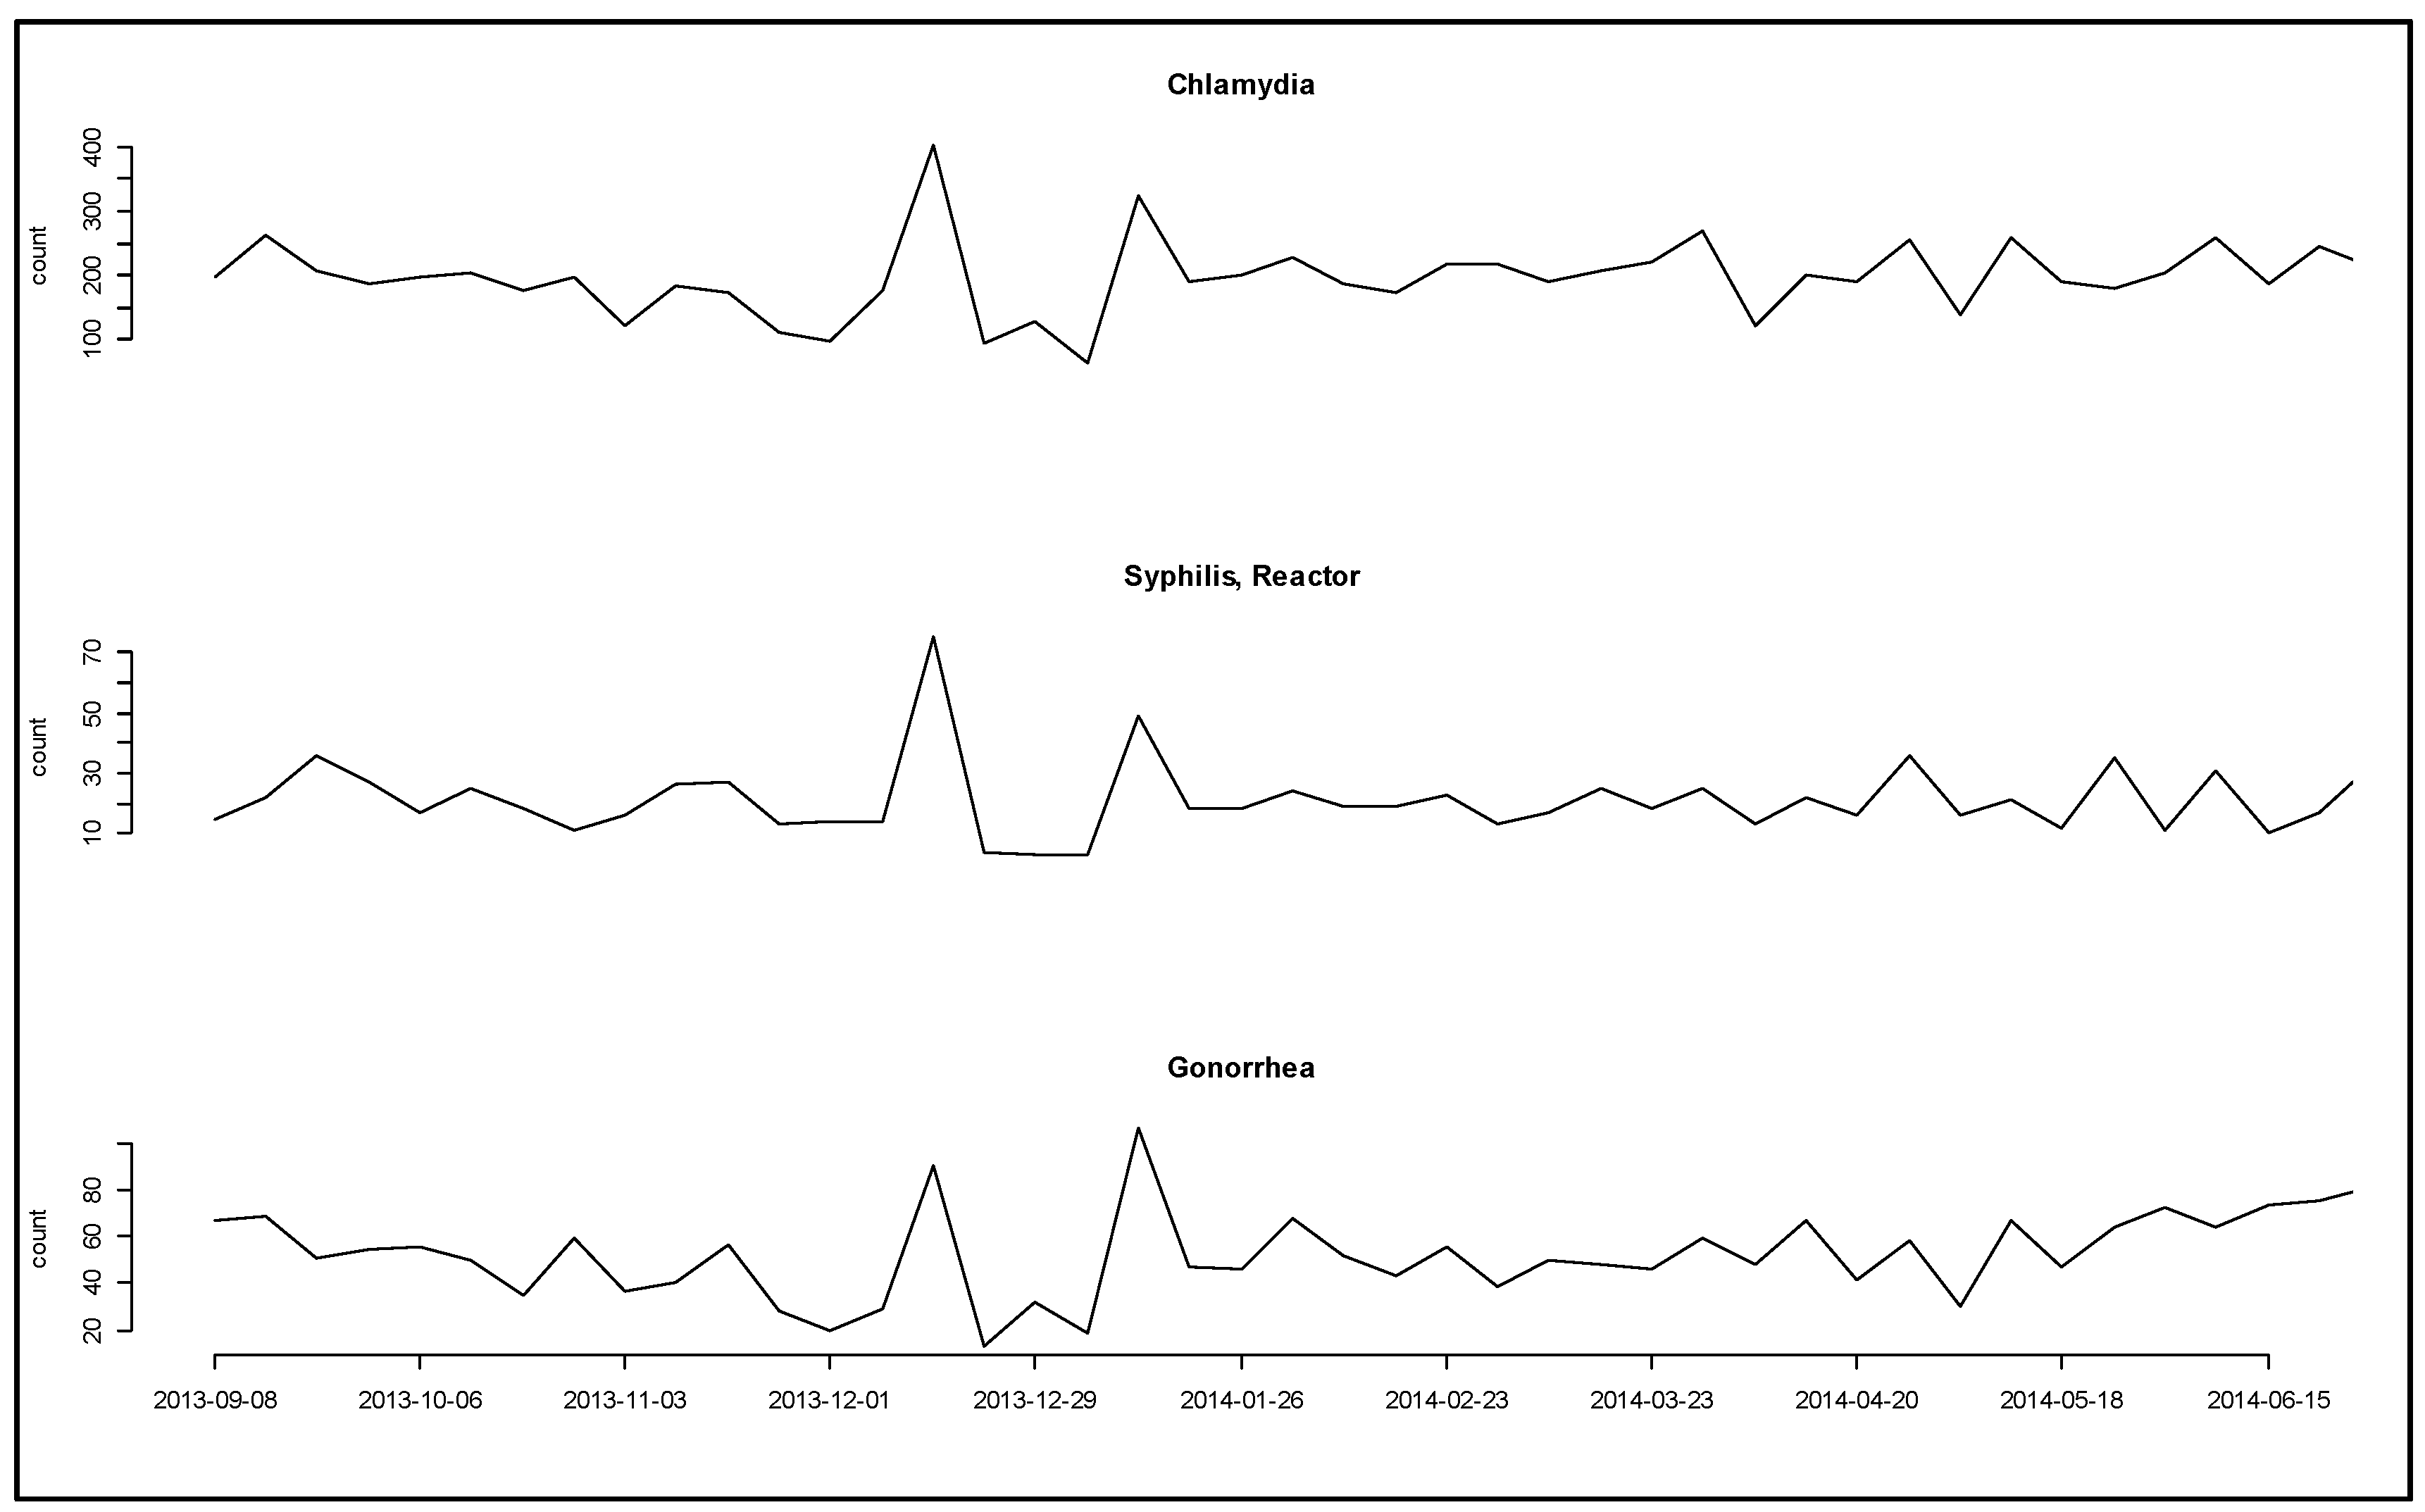
For example, Figure 4 shows a curious parallel double bump in counts for three diseases. The parallel increase suggests a change in the underlying process of testing or acquiring data rather than in the disease processes. The date range for the increase in disease counts suggests that a change in the processes of disease testing associated with December holidays may have contributed. However, the previous year saw no pattern of increases during the same time period.
|
Challenge 5
Unlike many other domains in which big data is used, big data for public health purposes needs to answer both "what" and "why" questions. Also, unlike some other health care fields, PHAs are responsible not only for the health of the communities they serve but also accountable to other government agencies and elected officials who must make decisions and enact policies based on public health surveillance observations. Incorporating metadata about a big data source can help guide answers to "what" and "why" questions that can arise when analyzing and interpreting findings.
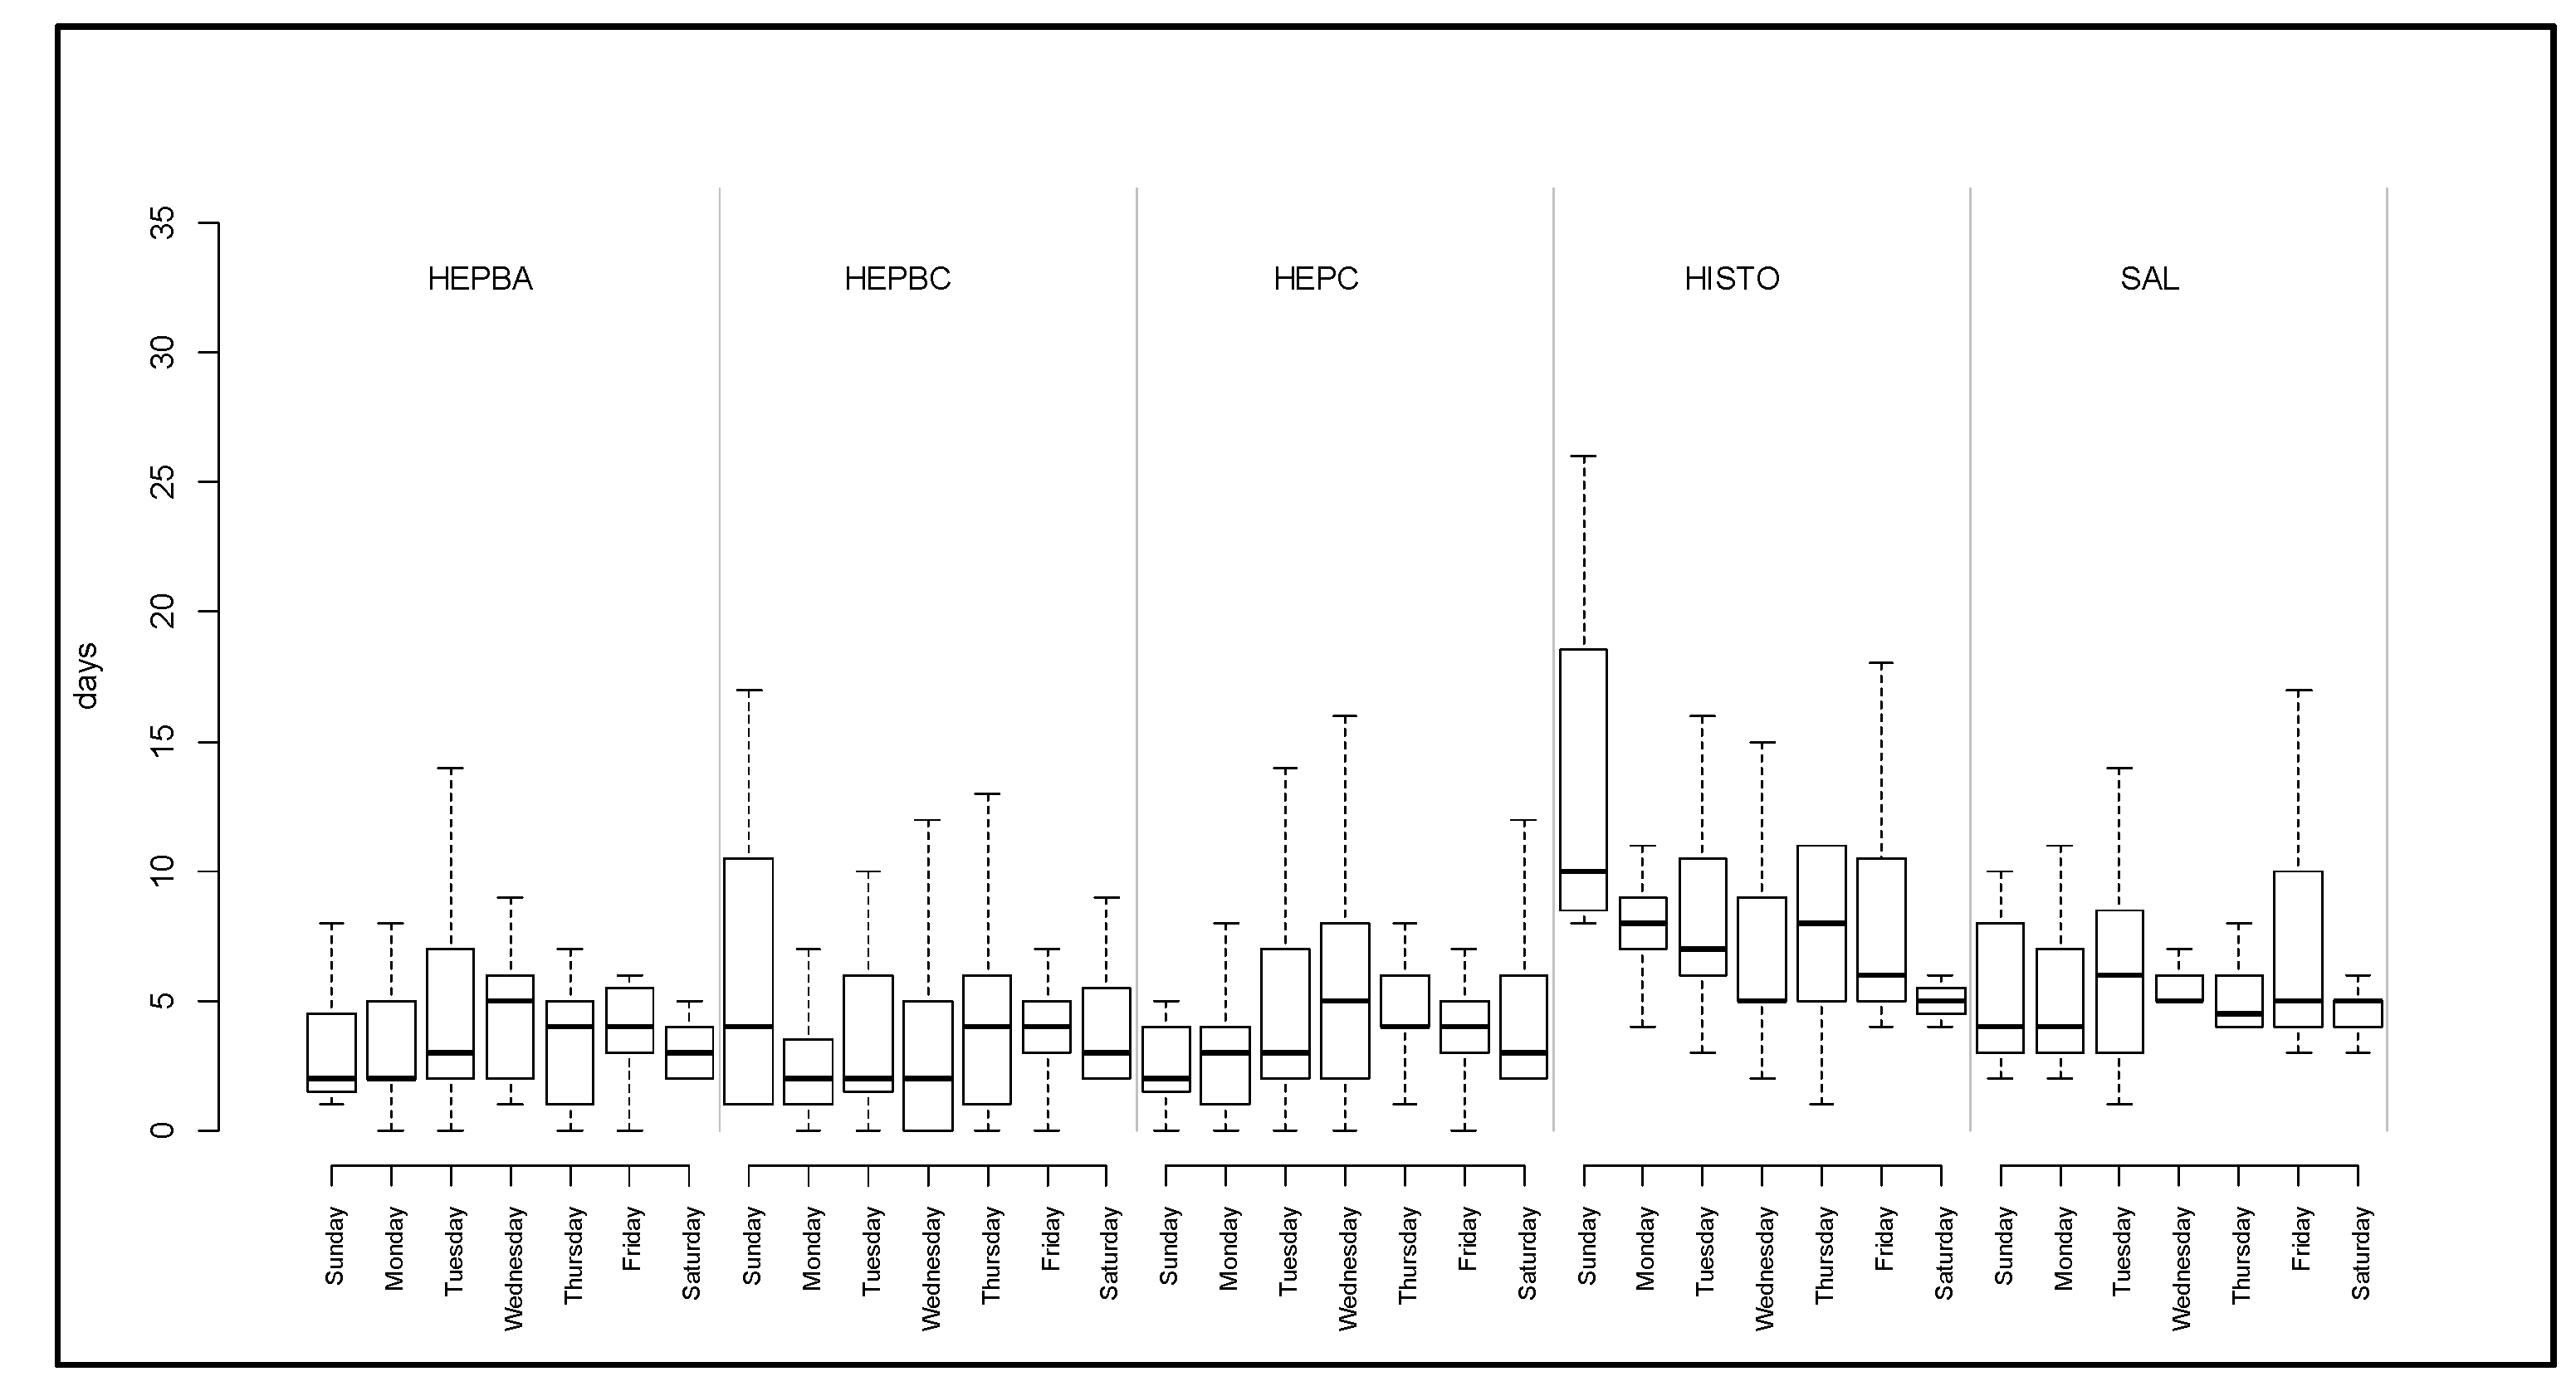
An illustration of this challenge is presented in Figure 5, a timeliness analysis which identified substantial differences by day of the week for lab test ordering and processing. These differences by day of the week appear to impact delivery of lab results to the PHA. It is unknown whether this could be accounted for in differences among labs in processing protocols, how a lab combines different test codes to generate a final test report, or other factors that might elucidate why this difference occurred. In turn, this timeliness difference could impact the timing for issuing a public health advisory to the community or to health care providers regarding an increased volume of, for example, acute hepatitis B. Needed metadata about lab processing and reporting practices could make the difference in timing for an advisory and also help elected officials feel more confident about a finding that could require policy decisions to stop the spread of a communicable disease in the community.
|
Table 2 is another illustration of the need for metadata, this focused on clinician reporting. We identified significant variation between the day of the week that a case report is received at the PHA, as well as considerable variation in reporting by condition. However, in the absence of contextual factors that can influence reporting variation, such as seasonal fluctuations in illness (for example, higher prevalence of influenza during winter months), interpretation of this finding requires more information.
| |||||||||||||||||||||||||||||||||||||||||||||||||||||||||||||||||||||||||||||||||||||||
Discussion
According to Khoury and Ioannidis, effective utilization of big data in public health centers on two challenges: addressing the trade-off between access and accuracy and the task of separating true signal from large and varied noise.[15] Our assessment of a large dataset available to public health not only provides examples of these challenges but also points to pathways for turning these challenges into opportunities.
Challenge 1: While PHAs almost exclusively rely on secondary use data for surveillance, big data that has been collected for clinical purposes omits data fields of high value for public health.
Opportunity: As important as secondary use data is for public health surveillance, public health lacks mechanisms to enforce completeness of fields or timely reporting. Our example of missing race/ethnicity data is a compelling case, as without this information a PHA will not be able to target health promotion efforts to the most affected or vulnerable populations. Public health is recognized as chronically underfunded; PHAs are not only unlikely to offer incentives for data collection, they need to use scarce resources wisely. Conducting a STI prevention program in a community that does not experience high levels of chlamydia, for example, would be wasteful as well as potentially cause friction in community relations. In recent years, some mechanisms, such as "meaningful use,"[16] have been enacted to expand current case reporting between hospitals/providers and public health and increase capacity for data management and analysis. Figure 1 shows evidence of improvement in the completeness rates of the ethnicity field for one database, largely having resulted from changes in the underlying process of collecting data for this field. However, enforcing compliance in complete and timely reporting may be outside the resources of public health.
Challenge 2: Big data is not always smart data, especially when the context within which the data is collected is absent.
Opportunity: A constant issue with notifiable condition reporting systems is the lack of a denominator for the number of positive test results, in part due to privacy reasons that are difficult to avoid. This lack of context limits the value of reportable systems for disease detection, mainly in terms of increasing the rate of false positive alerts. Big data methods to determine context from other data sources would be of great value for public health. The opportunity here is to make use of the experience big data has with processing unstructured data and data from multiple sources to use big data methods to help understand the context of the clinical data.
Challenge 3: Data collected by disparate, varying systems and sources can introduce uncertainties and limit trustworthiness in the data, which may diminish its value for public health purposes.
Opportunity: The further away the use of the data gets from the original purpose for its collection, the higher the potential for data quality, integrity, and value problems. There is the opportunity for public health to play a role providing population health-level situational awareness information back to the data originators. This would show value to data originators of data fields that they collect but do not directly use. An example of population health-level situational awareness information would be obesity rates within populations that match characteristics of the provider’s panel population.
Challenge 4: The process by which data is obtained needs to be evident in order for big data to be useful to public health.
Opportunity: Big data methods which can detect and adjust for underlying changes in the process that govern the collection of public health data would be beneficial. Three areas relating to metadata would be useful:
- Techniques for automatically identifying where metadata is needed would be useful (for example automatically identifying and flagging changes in data suggestive of underlying changes in the data generation process).
- Techniques for generating metadata from the data itself (for example, we used counts of cases processed on each day to generate metadata that indicates which days were days public health work was being performed).
- Techniques that adjust analyses based on metadata, especially with regard to data quality. In situations where PH entities have little recourse on improving DQ, methods that adjust for DQ need to be developed. For example, nowcasting methods (predicting the present state based on the incomplete data at hand) can account for data which accrues over time.[17][18][19]
Challenge 5: Big data for public health purposes needs to answer both "what" and "why" questions.
Opportunity: PH use of big data is unique in that it is constrained by risk of failure. If PH fails to stop an outbreak, preventable accidents, deaths, mortality can result (e.g., Ebola surveillance, detection, and prediction failure). If PH predicts an outbreak that does not materialize, the costs can include relationships with stakeholders, media, and the public. In addition, PH has a responsibility to monitor any data sources that it does receive; thus, data of unclear value to public health uses resources that may be better invested elsewhere.
Conclusions
Despite these and other issues—such as measurement error and confounding, well-known challenges to both big and small data—strategies traditionally employed by public health epidemiologists and other public health professionals can uncover limitations and contribute to the design of solutions in collection, integration, warehousing, and analysis of big data so its value and utility to public health can be optimized.
Acknowledgements
This study was conducted as part of the “Leveraging a HIE to Improve Public Health Disease Investigation” research project (RWJF Award #70338; PI: J Baseman, University of Washington, Seattle WA, USA). The content is solely the responsibility of the authors and does not necessarily represent the official views of the Robert Wood Johnson Foundation.
Author contributions
J.G.B., D.R. and I.P. conceived this paper; I.P. analyzed the data; J.G.B., D.R. and I.P. wrote the paper. All authors reviewed and approved revisions.
Conflicts of interest
The authors declare no conflict of interest.
References
- ↑ Miller, E. (2008). "Community cleverness required". Nature 455 (1). doi:10.1038/455001a.
- ↑ Kruse, C.S.; Goswamy, R.; Raval, Y.; Marawi, S. (2016). "Challenges and Opportunities of Big Data in Health Care: A Systematic Review". JMIR Medical Informatics 4 (4): e38. doi:10.2196/medinform.5359. PMC PMC5138448. PMID 27872036. https://www.ncbi.nlm.nih.gov/pmc/articles/PMC5138448.
- ↑ Jin, X.; Wah, B.W.; Cheng, X.; Wang, Y. (2015). "Significance and Challenges of Big Data Research". Big Data Research 2 (2). doi:10.1016/j.bdr.2015.01.006.
- ↑ Nambiar, R.; Bhardwaj, R.; Sethi, A.; Vargheese, R. (2013). "A look at challenges and opportunities of big data analytics in healthcare". Proceedings from the 2013 IEEE International Conference on Big Data: 17–22. doi:10.1109/BigData.2013.6691753.
- ↑ Joseph, S.; Sow, M.; Furukawa, M.F. et al. (2014). "HITECH spurs EHR vendor competition and innovation, resulting in increased adoption". American Journal of Managed Care 20 (9): 734-40. PMID 25365748.
- ↑ Roski, J.; Bo-Linn, G.W.; Andrews, T.A. (2014). "Creating value in health care through big data: Opportunities and policy implications". Health Affairs 33 (7): 1115-22. doi:10.1377/hlthaff.2014.0147. PMID 25006136.
- ↑ Groves, P.; Kayyali, B.; Knott, D.; Van Kuiken, S. (January 2013). "The 'big data' revolution in healthcare: Accelerating value and innovation". McKinsey & Company. https://www.mckinsey.com/~/media/mckinsey/industries/healthcare%20systems%20and%20services/our%20insights/the%20big%20data%20revolution%20in%20us%20health%20care/the_big_data_revolution_in_healthcare.ashx.
- ↑ Shah, G.H.; Leider, J.P.; Luo, H.; Kaur, R. (2016). "Interoperability of Information Systems Managed and Used by the Local Health Departments". Journal of Public Health Management and Practice 22 (Suppl. 6): S34-S43. doi:10.1097/PHH.0000000000000436. PMC PMC5049946. PMID 27684616. https://www.ncbi.nlm.nih.gov/pmc/articles/PMC5049946.
- ↑ "What Is Public Health?". CDC Foundation. https://www.cdcfoundation.org/what-public-health. Retrieved 12 October 2017.
- ↑ Barrett, M.A.; Humblet, O.; Hiatt, R.A.; Adler, N.E. (2013). "Big Data and Disease Prevention: From Quantified Self to Quantified Communities". Big Data 1 (3): 168-75. doi:10.1089/big.2013.0027. PMID 27442198.
- ↑ Meyer, A.M.; Olshan, A.F.; Green, L. et al. (2014). "Big data for population-based cancer research: the integrated cancer information and surveillance system". North Carolina Medical Journal 75 (4): 265–9. doi:10.1089/big.2013.0027. PMC PMC4766858. PMID 25046092. https://www.ncbi.nlm.nih.gov/pmc/articles/PMC4766858.
- ↑ Salathé, M.; Bengtsson, L.; Bodnar, T.J. et al. (2012). "Digital epidemiology". PLoS Computational Biology 8 (7): e1002616. doi:10.1371/journal.pcbi.1002616. PMC PMC3406005. PMID 22844241. https://www.ncbi.nlm.nih.gov/pmc/articles/PMC3406005.
- ↑ Painter, I.; Eaton. J.; Lober, B. (2013). "Using Change Point Detection for Monitoring the Quality of Aggregate Data". Online Journal of Public Health Informatics 5 (1): e186. doi:10.5210/ojphi.v5i1.4597.
- ↑ Zaslavsky, A.M.; Ayanian, J.Z.; Zaborski, L.B. (2012). "The validity of race and ethnicity in enrollment data for Medicare beneficiaries". Health Services Research 47 (3 Pt. 2): 1300–21. doi:10.1111/j.1475-6773.2012.01411.x. PMC PMC3349013. PMID 22515953. https://www.ncbi.nlm.nih.gov/pmc/articles/PMC3349013.
- ↑ Khoury, M.J.; Ioannidis, J.P. (2014). "Medicine: Big data meets public health". Science 346 (6213): 1054–5. doi:10.1126/science.aaa2709. PMC PMC4684636. PMID 25430753. https://www.ncbi.nlm.nih.gov/pmc/articles/PMC4684636.
- ↑ "Meaningful Use". CDC A–Z Index. Centers for Disease Control and Prevention. https://www.cdc.gov/ehrmeaningfuluse/. Retrieved 12 October 2017.
- ↑ Johansson, M.A.; Powers, A.M.; Pesik, N. et al.. "Nowcasting the spread of chikungunya virus in the Americas". PLoS One 9 (8): e104915. doi:10.1371/journal.pone.0104915. PMC PMC4128737. PMID 25111394. https://www.ncbi.nlm.nih.gov/pmc/articles/PMC4128737.
- ↑ Preis, T.; Moat, H.S.. "Adaptive nowcasting of influenza outbreaks using Google searches". Royal Society Open Science 1 (2): 140095. doi:10.1098/rsos.140095. PMC PMC4448892. PMID 26064532. https://www.ncbi.nlm.nih.gov/pmc/articles/PMC4448892.
- ↑ Althouse, B.M.; Scarpino, S.V.; Meyers, L.A. et al.. "Enhancing disease surveillance with novel data streams: Challenges and opportunities". EPJ Data Science 4: 17. doi:10.1140/epjds/s13688-015-0054-0. PMC PMC5156315. PMID 27990325. https://www.ncbi.nlm.nih.gov/pmc/articles/PMC5156315.
Notes
This presentation is faithful to the original, with only a few minor changes to presentation. In some cases important information was missing from the references, and that information was added. Several URL from the original were dead, and more current URLs were substituted.
