Difference between revisions of "Journal:Data management of microscale reaction calorimeter using a modular open-source IoT platform"
Shawndouglas (talk | contribs) (Created stub. Saving and adding more.) |
Shawndouglas (talk | contribs) (Saving and adding more.) |
||
| Line 34: | Line 34: | ||
==Introduction== | ==Introduction== | ||
The [[internet of things]] (IoT) enables a technical world in which most any device can be connected to the internet and provide real-time data to both other devices and central control systems. [1] Thus, processes and [[workflow]]s can be automated for many applications. Focusing specifically on chemical [[Laboratory|laboratories]], IoT systems allow chemists, for example, to monitor their reactions in real-time and view the data as needed. In this context, automated, continuously operated, small-scale apparatuses—in research laboratories in particular—represent data factories whose [[Information management|data must be managed]] accordingly. [2] With such apparatuses, input parameters such as flow rate, temperature, and stirrer speed can be changed quickly. The system also adapts quickly to changing conditions due to the instruments' small size. This allows sequential experiments to be performed in rapid succession, often in a semi-automated way, minimizing time-consuming and repetitive tasks for researchers and enabling them to focus more on interpreting results. In addition, data, and thus also research data, must be stored, processed, and interpreted in a meaningful way. In 2016, Wilkinson ''et al.'' [3] proposed the FAIR Data Principles, which formulate principles that sustainable and reusable research data must fulfil and that data infrastructures should implement accordingly as part of the services they offer. According to the principles, data should be findable, accessible, interoperable, and re-usable (FAIR).[3] | |||
Many different platforms have been presented to realize automated processes in academic research laboratories and to monitor them. Since we perform research in the field of chemical engineering, the following overview of platforms presented in literature is limited to research groups in the same field. In the past, most autonomous platforms made use of LabVIEW [4] and Matlab [5] for [[Laboratory automation|automation]] of equipment control and data management. However, open-source alternatives and [[Cloud computing|cloud-based]] systems that enable remote control and monitoring are currently trending at the university level. [7,8] (For example, Cherkasov ''et al.'' [6] have developed OpenFlowChem, based on the proprietary LabVIEW.) The advantage of [[Free and open-source software|open-source software]] lies in reduced costs, since no licenses are required; the low entry barrier to programming through support from other researchers; and the community and forums; as well as simple access to tutorials on the internet. Moreover, rapid transfer and adaptation is possible. Here, the developments of O’Brien ''et al.'' [9], Ingham ''et al.'' [10], and Steiner ''et al.'' [11] can be mentioned. Recently, van der Westhuizen ''et al.'' [12] presented an approach to monitor and control flow chemistry reactors using open-source software. They used the Node-RED platform [13] to develop [[Dashboard (business)|dashboards]], which are similar to LabVIEW. All the mentioned platforms still require different applications to be installed individually by the user and lack the possibility of accessing the various applications centrally at different locations by different users with individual rights, which supports the operator and data scientists in data processing and evaluation. | |||
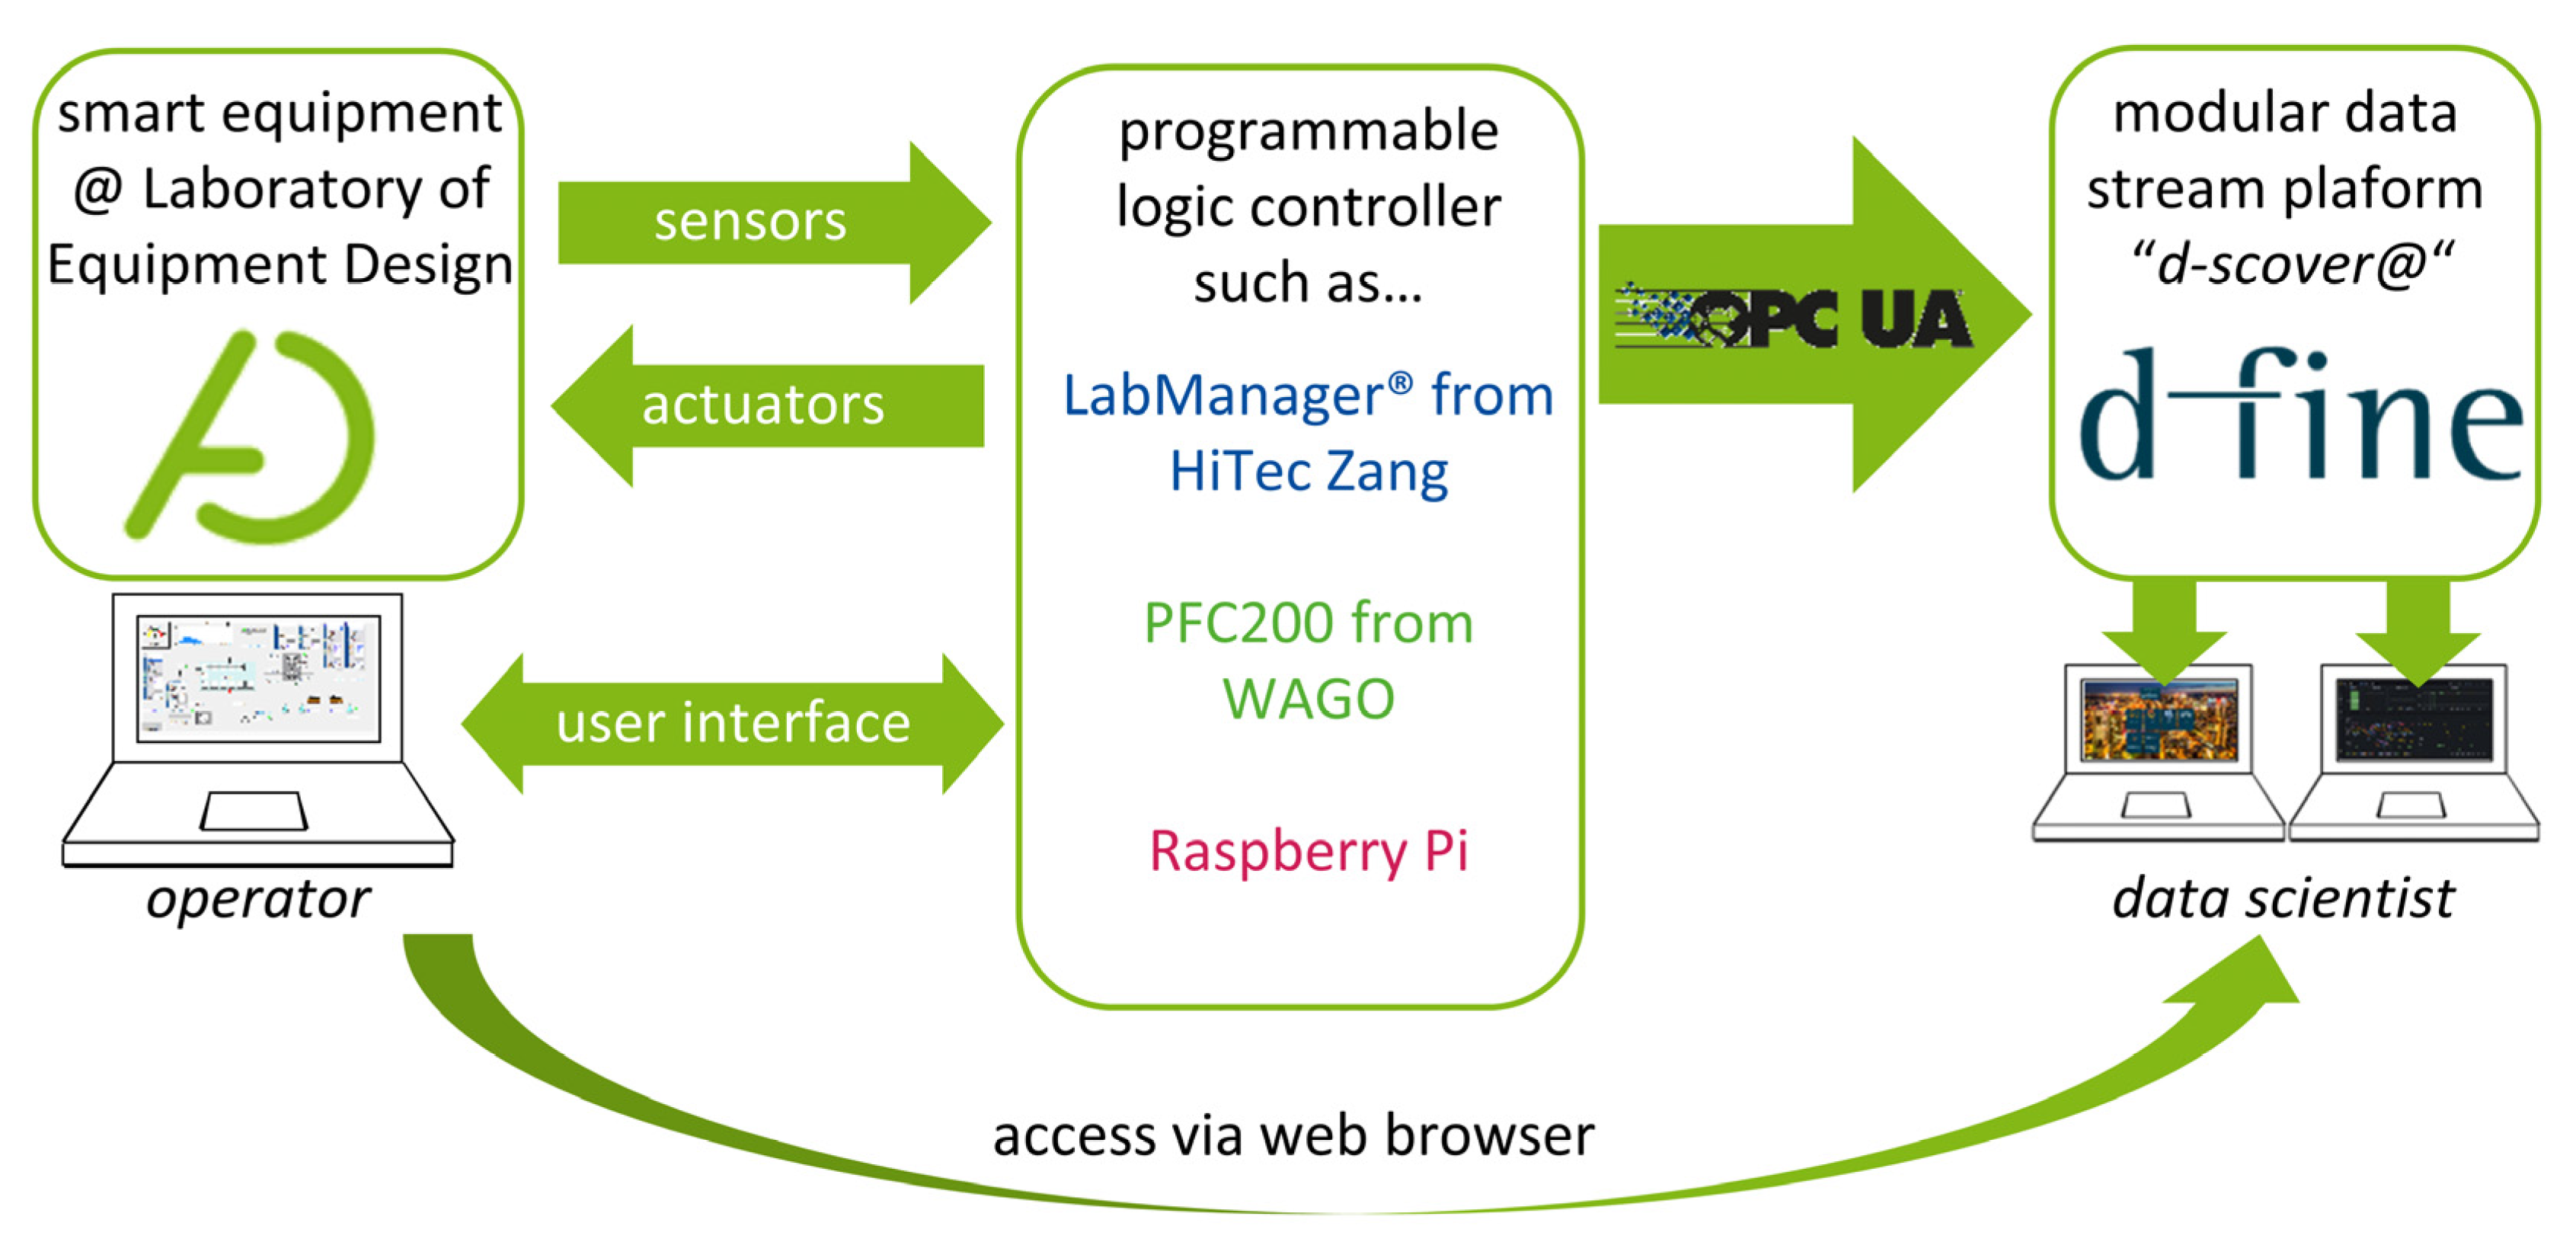
To standardize data management within our laboratory, we have teamed up with d-fine (Frankfurt a.M., Germany), a European consulting firm providing innovative and future-proof solutions through sustainable technological implementation to establish “d-fine’s smart containerized versatile analytics toolbox” (d-scover@) [14] for our experimental workflows. The open-source IoT-platform d-scover@ allows for the quick setup of a sophisticated but robust data supply and analysis tool chain at TU Dortmund University's Laboratory of Equipment Design. Figure 1 shows how different smart devices can be connected to the d-scover@ platform. | |||
[[File:Fig1 Frede Processes23 11-1.png|800px]] | |||
{{clear}} | |||
{| | |||
| style="vertical-align:top;" | | |||
{| border="0" cellpadding="5" cellspacing="0" width="800px" | |||
|- | |||
| style="background-color:white; padding-left:10px; padding-right:10px;" |<blockquote>'''Figure 1.''' Overview of the connection of the d-scover@ platform to existing smart equipment in laboratories..</blockquote> | |||
|- | |||
|} | |||
|} | |||
Revision as of 18:31, 19 April 2023
| Full article title | Data management of microscale reaction calorimeter using a modular open-source IoT platform |
|---|---|
| Journal | Processes |
| Author(s) | Frede, Timothy A.; Weber, Constantin; Brockhoff, Tobias; Christ, Tassilo; Ludwig, Denis; Kockmann, Norbert |
| Author affiliation(s) | TU Dortmund University, d-fine GmbH |
| Primary contact | Email: timothy dot frede at tu dash dortmund dot de |
| Year published | 2023 |
| Volume and issue | 11(1) |
| Article # | 279 |
| DOI | 10.3390/pr11010279 |
| ISSN | 2227-9717 |
| Distribution license | Creative Commons Attribution 4.0 International |
| Website | https://www.mdpi.com/2227-9717/11/1/279 |
| Download | https://www.mdpi.com/2227-9717/11/1/279/pdf (PDF) |
|
|
This article should be considered a work in progress and incomplete. Consider this article incomplete until this notice is removed. |
Abstract
Unifying research data collection methods and capturing data streams in an organized and standardized manner are becoming increasingly important in laboratories as digital processes and automation progressively shape the laboratory workflows. In this context, the internet of things (IoT) not only offers the opportunity to minimize time-consuming and repetitive tasks by delegating them to machines, but it also supports scientists in curating data. As a contribution to the establishment of IoT tools in academic research laboratories, a microscale reaction calorimeter is exemplarily connected to a modular open-source IoT-platform. The microscale calorimeter’s process data is streamed to the data platform for storage and analysis. Advantages of the platform from academia’s point of view are presented. Finally, the application of the platform was successfully tested with the hydrolysis of acetic anhydride. The data were accessed and analyzed exclusively via the IoT-platform, which provided important advantages for the operator in terms of standardized evaluation in just a few steps.
Keywords: data curation, data management, flow calorimetry, internet of things, open-source software
Introduction
The internet of things (IoT) enables a technical world in which most any device can be connected to the internet and provide real-time data to both other devices and central control systems. [1] Thus, processes and workflows can be automated for many applications. Focusing specifically on chemical laboratories, IoT systems allow chemists, for example, to monitor their reactions in real-time and view the data as needed. In this context, automated, continuously operated, small-scale apparatuses—in research laboratories in particular—represent data factories whose data must be managed accordingly. [2] With such apparatuses, input parameters such as flow rate, temperature, and stirrer speed can be changed quickly. The system also adapts quickly to changing conditions due to the instruments' small size. This allows sequential experiments to be performed in rapid succession, often in a semi-automated way, minimizing time-consuming and repetitive tasks for researchers and enabling them to focus more on interpreting results. In addition, data, and thus also research data, must be stored, processed, and interpreted in a meaningful way. In 2016, Wilkinson et al. [3] proposed the FAIR Data Principles, which formulate principles that sustainable and reusable research data must fulfil and that data infrastructures should implement accordingly as part of the services they offer. According to the principles, data should be findable, accessible, interoperable, and re-usable (FAIR).[3]
Many different platforms have been presented to realize automated processes in academic research laboratories and to monitor them. Since we perform research in the field of chemical engineering, the following overview of platforms presented in literature is limited to research groups in the same field. In the past, most autonomous platforms made use of LabVIEW [4] and Matlab [5] for automation of equipment control and data management. However, open-source alternatives and cloud-based systems that enable remote control and monitoring are currently trending at the university level. [7,8] (For example, Cherkasov et al. [6] have developed OpenFlowChem, based on the proprietary LabVIEW.) The advantage of open-source software lies in reduced costs, since no licenses are required; the low entry barrier to programming through support from other researchers; and the community and forums; as well as simple access to tutorials on the internet. Moreover, rapid transfer and adaptation is possible. Here, the developments of O’Brien et al. [9], Ingham et al. [10], and Steiner et al. [11] can be mentioned. Recently, van der Westhuizen et al. [12] presented an approach to monitor and control flow chemistry reactors using open-source software. They used the Node-RED platform [13] to develop dashboards, which are similar to LabVIEW. All the mentioned platforms still require different applications to be installed individually by the user and lack the possibility of accessing the various applications centrally at different locations by different users with individual rights, which supports the operator and data scientists in data processing and evaluation.
To standardize data management within our laboratory, we have teamed up with d-fine (Frankfurt a.M., Germany), a European consulting firm providing innovative and future-proof solutions through sustainable technological implementation to establish “d-fine’s smart containerized versatile analytics toolbox” (d-scover@) [14] for our experimental workflows. The open-source IoT-platform d-scover@ allows for the quick setup of a sophisticated but robust data supply and analysis tool chain at TU Dortmund University's Laboratory of Equipment Design. Figure 1 shows how different smart devices can be connected to the d-scover@ platform.
|
References
Notes
This presentation is faithful to the original, with only a few minor changes to presentation. In some cases important information was missing from the references, and that information was added.


