Journal:Data management of microscale reaction calorimeter using a modular open-source IoT platform
| Full article title | Data management of microscale reaction calorimeter using a modular open-source IoT platform |
|---|---|
| Journal | Processes |
| Author(s) | Frede, Timothy A.; Weber, Constantin; Brockhoff, Tobias; Christ, Tassilo; Ludwig, Denis; Kockmann, Norbert |
| Author affiliation(s) | TU Dortmund University, d-fine GmbH |
| Primary contact | Email: timothy dot frede at tu dash dortmund dot de; tassilo dot christ at d dash fine dot de |
| Year published | 2023 |
| Volume and issue | 11(1) |
| Article # | 279 |
| DOI | 10.3390/pr11010279 |
| ISSN | 2227-9717 |
| Distribution license | Creative Commons Attribution 4.0 International |
| Website | https://www.mdpi.com/2227-9717/11/1/279 |
| Download | https://www.mdpi.com/2227-9717/11/1/279/pdf (PDF) |
|
|
This article should be considered a work in progress and incomplete. Consider this article incomplete until this notice is removed. |
|
|
This article contains rendered mathematical formulae. You may require the TeX All the Things plugin for Chrome or the Native MathML add-on and fonts for Firefox if they don't render properly for you. |
Abstract
Unifying research data collection methods and capturing data streams in an organized and standardized manner are becoming increasingly important in laboratories as digital processes and automation progressively shape the laboratory workflows. In this context, the internet of things (IoT) not only offers the opportunity to minimize time-consuming and repetitive tasks by delegating them to machines, but it also supports scientists in curating data. As a contribution to the establishment of IoT tools in academic research laboratories, a microscale reaction calorimeter is exemplarily connected to a modular open-source IoT-platform. The microscale calorimeter’s process data is streamed to the data platform for storage and analysis. Advantages of the platform from academia’s point of view are presented. Finally, the application of the platform was successfully tested with the hydrolysis of acetic anhydride. The data were accessed and analyzed exclusively via the IoT-platform, which provided important advantages for the operator in terms of standardized evaluation in just a few steps.
Keywords: data curation, data management, flow calorimetry, internet of things, open-source software
Introduction
The internet of things (IoT) enables a technical world in which most any device can be connected to the internet and provide real-time data to both other devices and central control systems. [1] Thus, processes and workflows can be automated for many applications. Focusing specifically on chemical laboratories, IoT systems allow chemists, for example, to monitor their reactions in real-time and view the data as needed. In this context, automated, continuously operated, small-scale apparatuses—in research laboratories in particular—represent data factories whose data must be managed accordingly. [2] With such apparatuses, input parameters such as flow rate, temperature, and stirrer speed can be changed quickly. The system also adapts quickly to changing conditions due to the instruments' small size. This allows sequential experiments to be performed in rapid succession, often in a semi-automated way, minimizing time-consuming and repetitive tasks for researchers and enabling them to focus more on interpreting results. In addition, data, and thus also research data, must be stored, processed, and interpreted in a meaningful way. In 2016, Wilkinson et al. [3] proposed the FAIR Data Principles, which formulate principles that sustainable and reusable research data must fulfil and that data infrastructures should implement accordingly as part of the services they offer. According to the principles, data should be findable, accessible, interoperable, and re-usable (FAIR).[3]
Many different platforms have been presented to realize automated processes in academic research laboratories and to monitor them. Since we perform research in the field of chemical engineering, the following overview of platforms presented in literature is limited to research groups in the same field. In the past, most autonomous platforms made use of LabVIEW [4] and Matlab [5] for automation of equipment control and data management. However, open-source alternatives and cloud-based systems that enable remote control and monitoring are currently trending at the university level. [7,8] (For example, Cherkasov et al. [6] have developed OpenFlowChem, based on the proprietary LabVIEW.) The advantage of open-source software lies in reduced costs, since no licenses are required; the low entry barrier to programming through support from other researchers; and the community and forums; as well as simple access to tutorials on the internet. Moreover, rapid transfer and adaptation is possible. Here, the developments of O’Brien et al. [9], Ingham et al. [10], and Steiner et al. [11] can be mentioned. Recently, van der Westhuizen et al. [12] presented an approach to monitor and control flow chemistry reactors using open-source software. They used the Node-RED platform [13] to develop dashboards, which are similar to LabVIEW. All the mentioned platforms still require different applications to be installed individually by the user and lack the possibility of accessing the various applications centrally at different locations by different users with individual rights, which supports the operator and data scientists in data processing and evaluation.
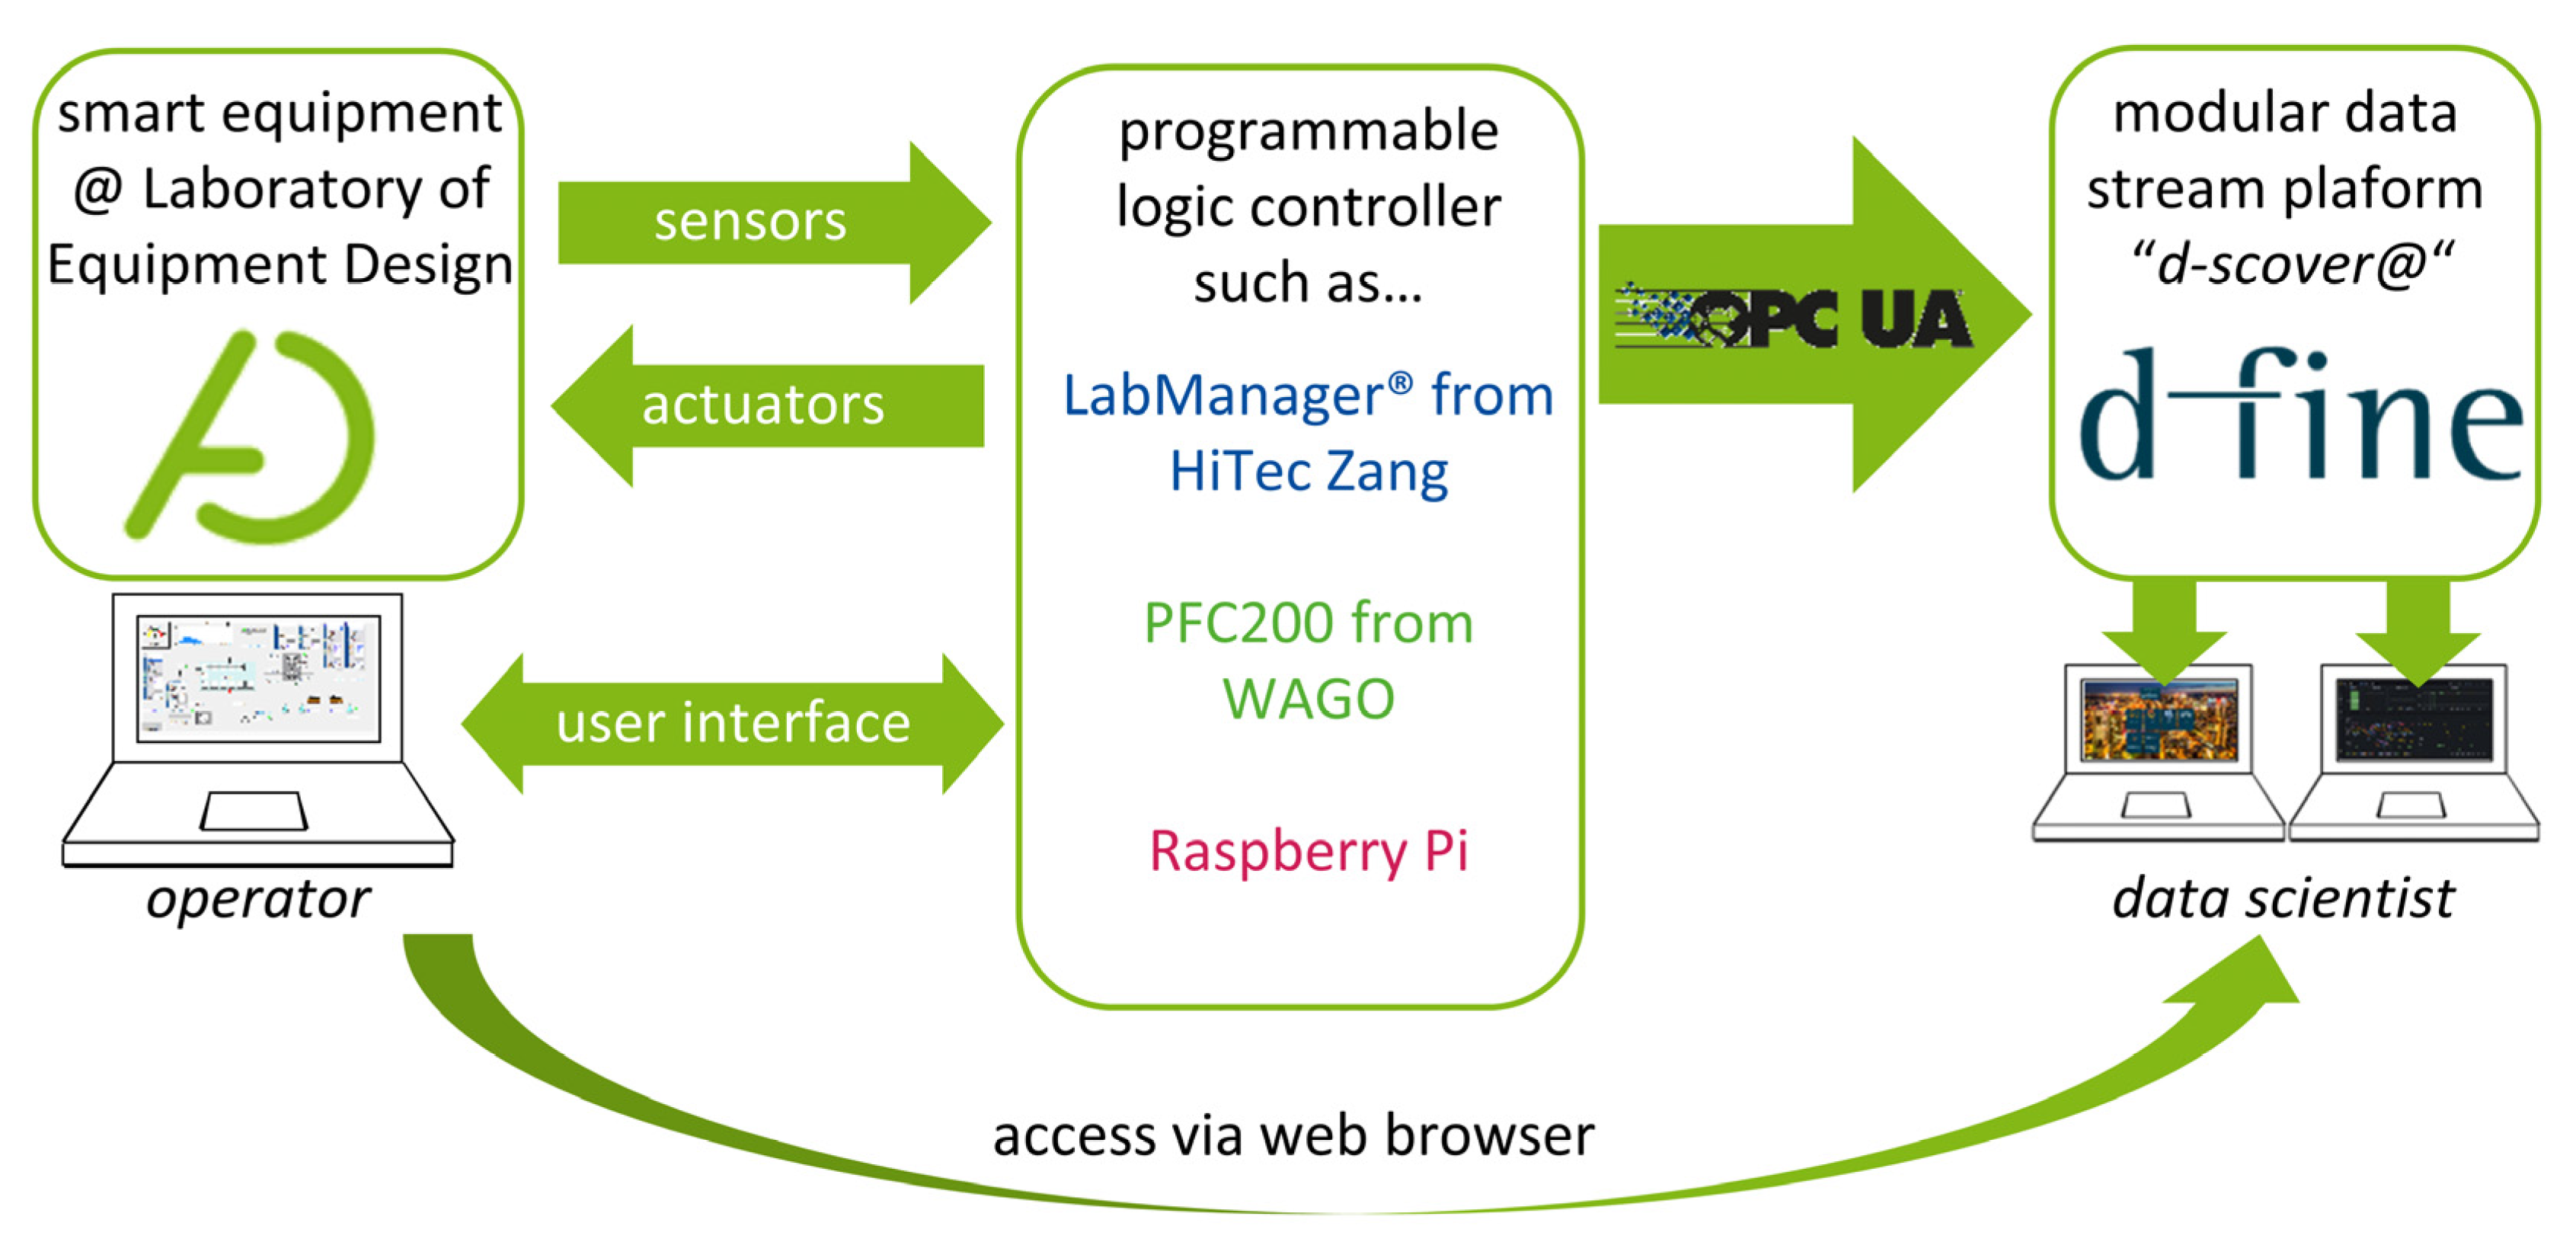
To standardize data management within our laboratory, we have teamed up with d-fine (Frankfurt a.M., Germany), a European consulting firm providing innovative and future-proof solutions through sustainable technological implementation to establish “d-fine’s smart containerized versatile analytics toolbox” (d-scover@) [14] for our experimental workflows. The open-source IoT-platform d-scover@ allows for the quick setup of a sophisticated but robust data supply and analysis tool chain at TU Dortmund University's Laboratory of Equipment Design. Figure 1 shows how different smart devices can be connected to the d-scover@ platform.
|
Since our equipment is in most cases already connected to a programmable logic controller (PLC) such as LabManager (HiTec Zang, Herzogenrath, Germany), Controller PFC200 (WAGO GmbH & Co., Minden, Germany) and single-board computers, e.g., Raspberry Pi 4B (Raspberry Pi Foundation, Cambridge, England), existing interfaces can be used for data transfer. Within our research group, the interface of Open Platform Communications Unified Architecture (OPC UA) is established as the standard for data exchange.
By establishing the modular data stream platform, the following FAIR Guiding Principles, according to Wilkinson et al. [3], are specifically addressed:
- data are assigned a globally unique and persistent identifier (F1);
- the protocol is open, free, and universally implementable (A1.1);
- the protocol allows for an authentication and authorization procedure where necessary (A1.2);
- data use vocabularies that follow FAIR principles (I2);
- data are released with a clear and accessible data usage license (R1.1); and
- data meet domain-relevant community standards (R1.3).
In this work, the d-scover@ platform from d-fine is used for data management of an automated microfluidic reaction calorimeter. For this, the IoT platform and its tools are presented first. Subsequently, the microscale calorimeter and its measurement data are described. Finally, the benefits of using the IoT platform for the microscale calorimeter are demonstrated and discussed with the investigation of the hydrolysis of acetic anhydride.
Materials and methods
Open-source IoT platform
Industrial corporates increasingly strive to automate as much of their value creation as possible to increase productivity, react faster to changing market conditions and disrupted supply chains, and to cope with a lack of qualified workforce. A digital representation of all inbound, in-house, and outbound processes is mandatory for this.
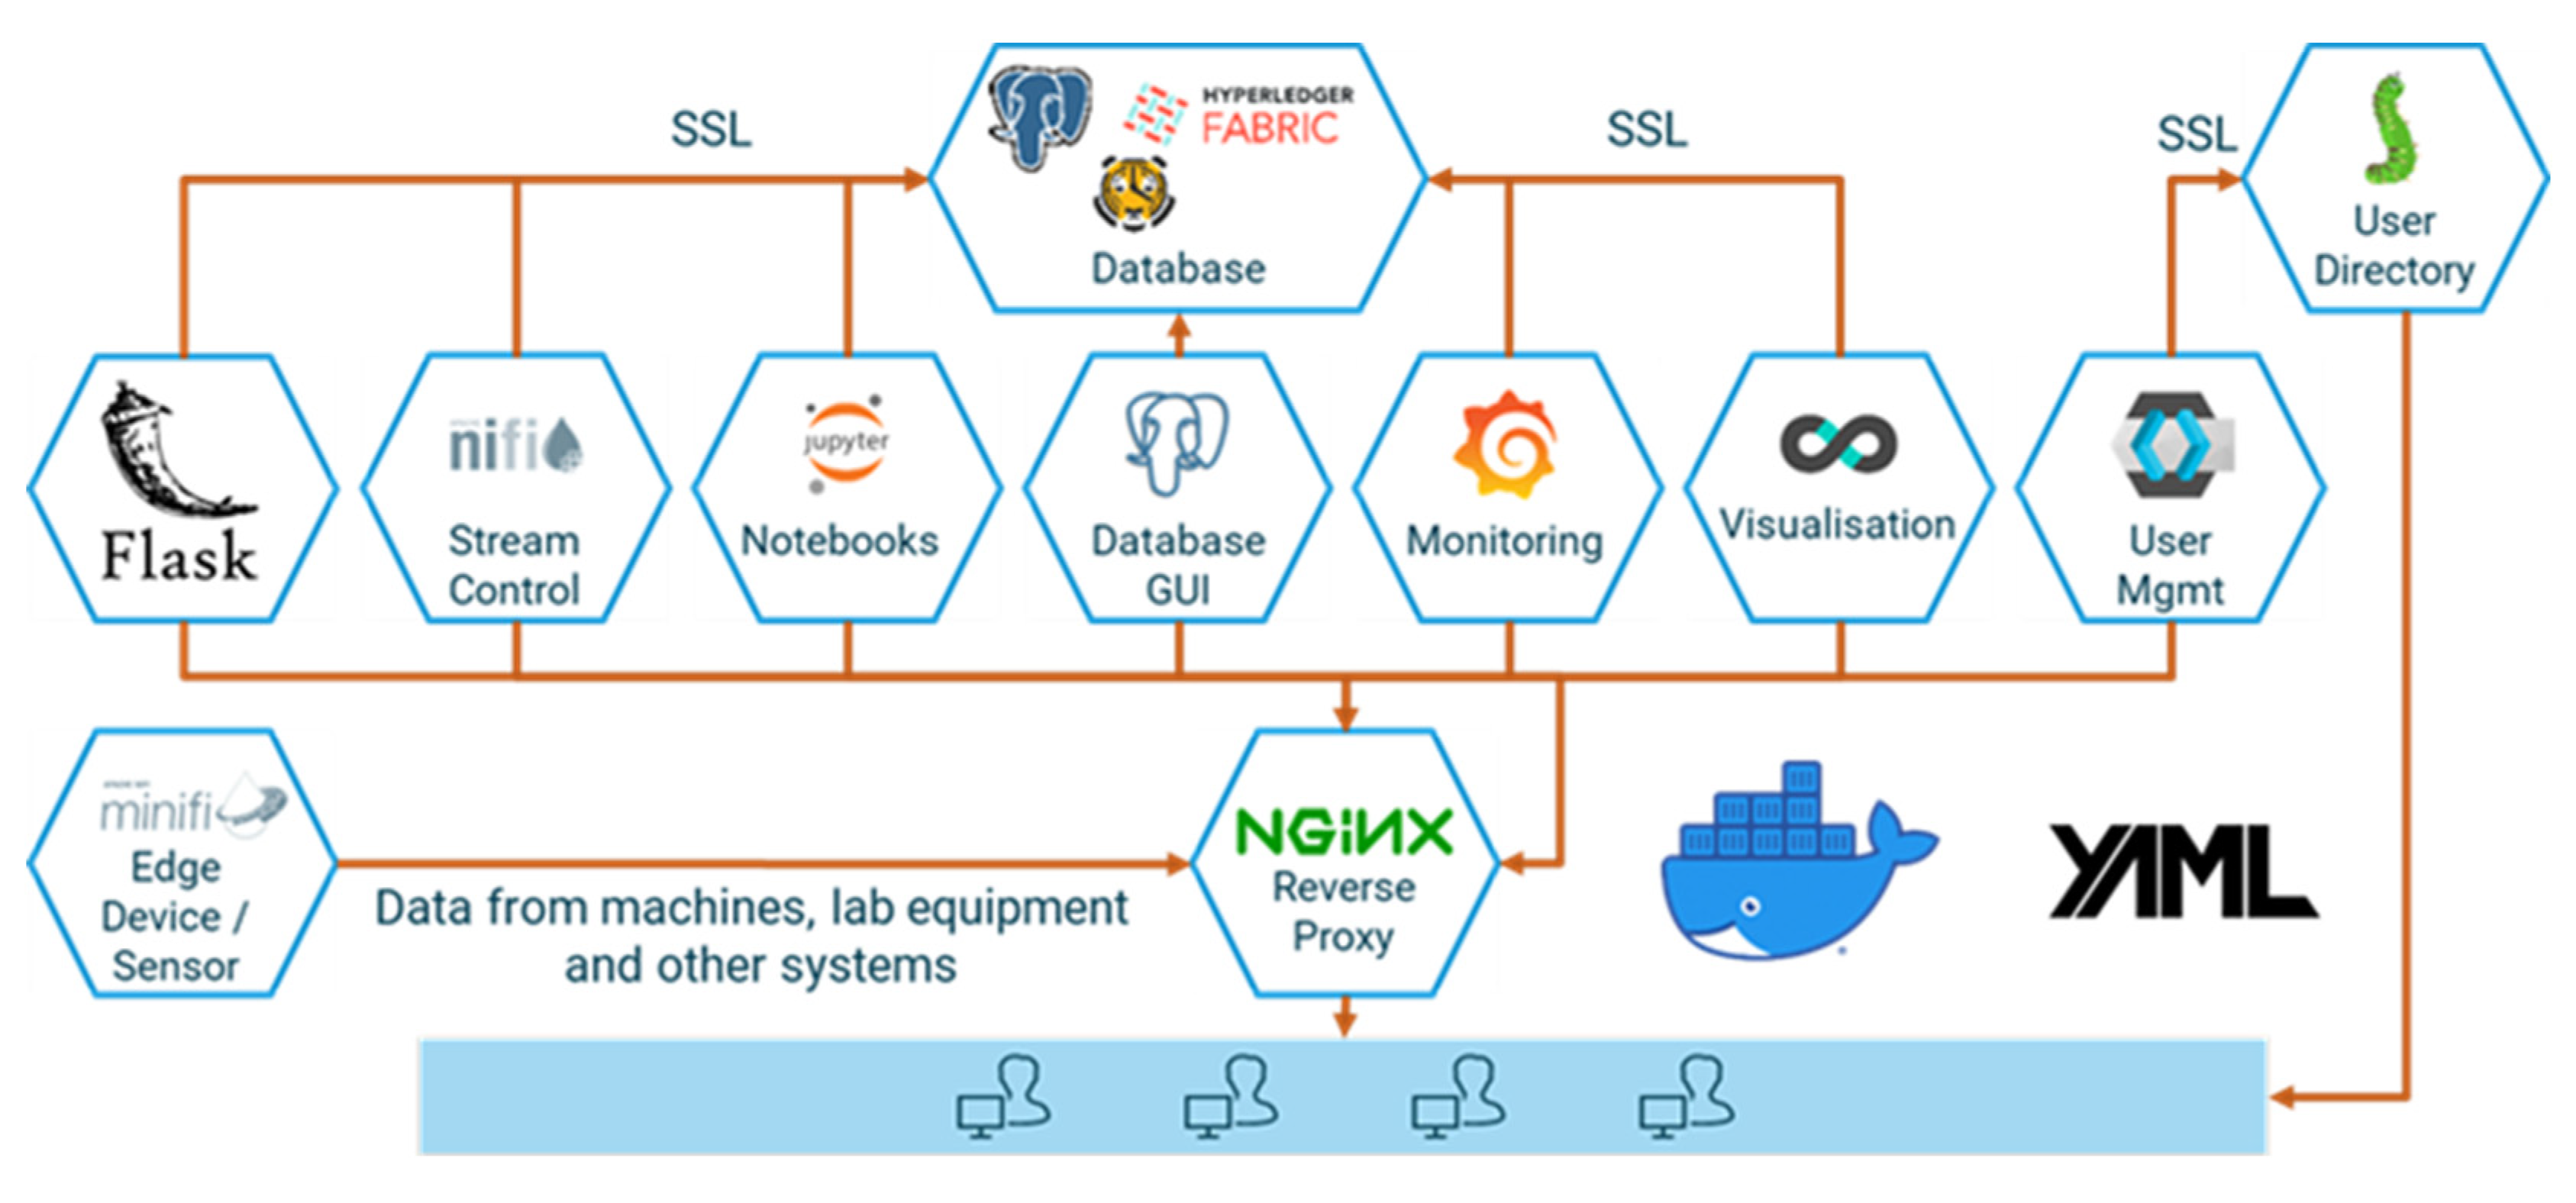
Acquiring the necessary process data from machines and sensors, storing them in a consistent manner, and analyzing and sharing them—frequently not only across corporate divisions but also with suppliers and customers—requires a fully integrated end-to-end data platform. However, competing IT standards and protocols, and the need to integrate external and “legacy” systems, make this a daunting task. The same is true—albeit on a smaller scale—for scientific laboratory equipment, in particular if heterogeneous devices need to be managed. To facilitate quick operational wins and ensure a steep learning curve at virtually no cost, we use a modular open-source platform in our laboratory. d-fine’s IoT suite d-scover@ is available under a permissive open-source license and is used in industry and science to build reliable and secure data pipelines with minimal investment. It comprises open-source data storage backends and an extract, transform, load (ETL) stack for extracting data from different sources, transforming them into the desired target format and loading the results into the storage systems. Modelling and data analysis capabilities are provided via a secure execution environment for Python notebooks. A reverse proxy, a web portal and tools for user management, logging, and network setup complement the system. In Figure 2, an overview of the underlying open-source tech-stack is provided.
|
d-scover@ provides for container-based deployment, ready-to-use network configuration, and continuous integration support. It can be easily extended and allows for standalone user management or integration with active directory.
The suite was installed on the Department of Biochemical and Chemical Engineering's intranet and connected to the laboratory equipment—described in the Results section—by members of the Laboratory of Equipment Design and the d-fine IIoT-division. Analyses—also discussed in the Results section—were performed with the Python analytics backend of d-scover@. For details about the platform, installation support, and functional extensions, please contact the corresponding author from d-fine.
Microscale flow reaction calorimeter
Experimental setup and data acquisition
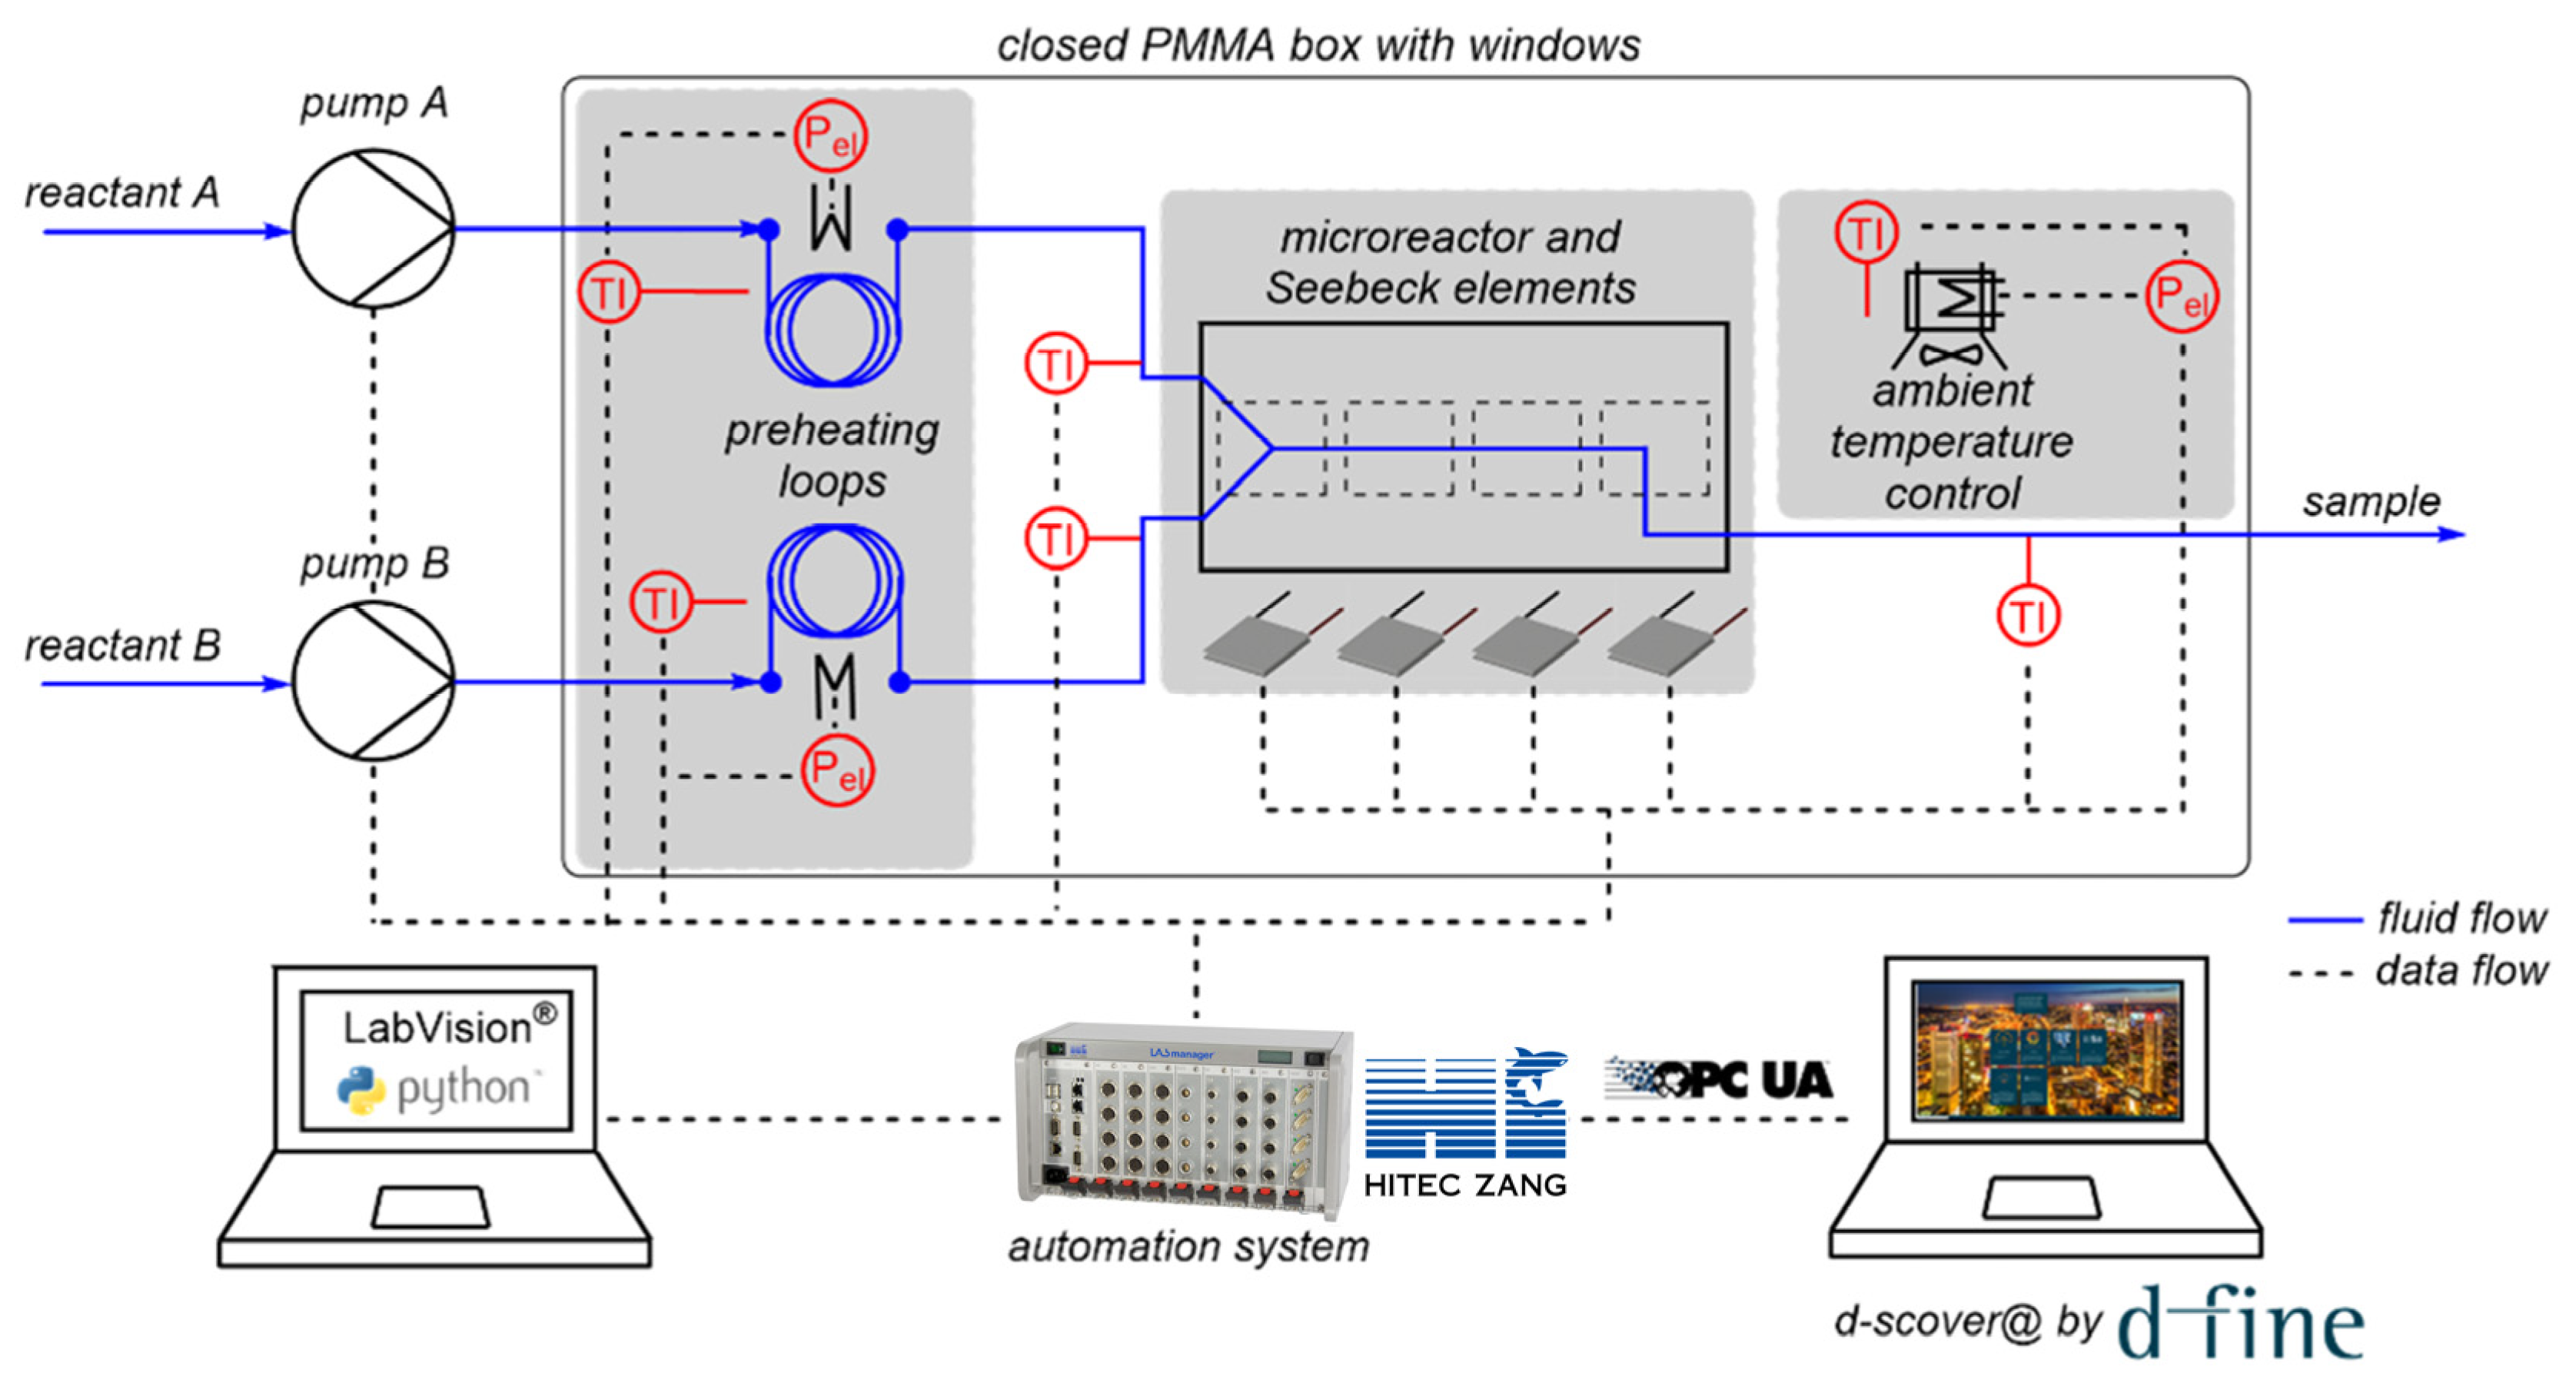
The open-source IoT platform d-scover@ is used for the setup of a microscale flow reaction calorimeter employed in our laboratory. The continuously operated, microfluidic reaction calorimeter measures the temporal and spatial heat release of chemical processes using Seebeck elements (SEs), and thus enables the determination of thermokinetic data. The whole setup for calorimetric measurements is shown schematically in Figure 3.
|
As centerpiece of the setup, the microscale calorimeter consists of a commercially available microreactor (LTF-MS, Little Things Factory, Elsoff, Germany) and twelve Seebeck elements (SEs) (QC-31-1.0–3.0M, Quick-Ohm Küpper & Co., Wuppertal, Germany) to measure the heat flux along the reaction channel. The calorimeter is placed in a closed, temperature-controlled box made of aluminum profiles with transparent poly(methyl methacrylate) walls to minimize external influences on the measurements, in particular environmental temperature fluctuations. The reactants are fed into the reactor via syringe pumps (VIT-FIT, Lambda Instruments, Baar, Switzerland). The reactants’ inlet temperatures are controlled using preheating loops, which are also located in the closed box. The individual components such as pumps, SEs, and temperature sensors are connected to a laboratory automation system (LabManager, HiTec Zang, Herzogenrath, Germany) enabling automated experimentation. A graphical user interface (GUI) is generated using the proprietary visualization and automation software LabVision. Additionally, the operator is assisted by a self-developed software-guided workflow. First, a sequence of experiments is determined by the operator, in which the flow rates and temperature can be varied. Next, the measured process data are imported by LabManager and the experiments are performed automatically in the specified order with the specified parameters.
Process and calorimetric data
During the performance of calorimetric measurements, measured process data are collected, which are subsequently used to determine calorimetric data such as the reaction enthalpy. The determination of the thermokinetic data is based on balancing of the energy of the entire system or the individual reactor sections above the SEs. Here, only a brief introduction of the energy balance is given. More details can be found in previous works. [15,16] The general energy balance equation that applies to both methods is:
The heat fluxes that must be considered in the balance are the convective heat flux through the flow fluid , the measured heat flux of the SEs , the heat loss not measured by the SEs, and the energy brought into the system by the reaction . Since the experiments are evaluated in steady-state, the previous equation can be solved for the reaction enthalpy as such:
Hence, the reaction enthalpy can be determined directly from measured process data once steady-state is reached. In Table 1, the process data measured by the calorimeter setup and the determined thermokinetic data using the calorimetric measurement method are listed.
| ||||||||||||||||||||||||||||||||||||||||||||||||||||||||||||
References
Notes
This presentation is faithful to the original, with only a few minor changes to presentation. In some cases important information was missing from the references, and that information was added.


