Journal:Design of a data management reference architecture for sustainable agriculture
| Full article title | Design of a data management reference architecture for sustainable agriculture |
|---|---|
| Journal | Sustainability |
| Author(s) | Giray, Görkem; Catal, Cagatay |
| Author affiliation(s) | Independent researcher, Qatar University |
| Primary contact | Email: gorkemgiray at gmail dot com |
| Year published | 2021 |
| Volume and issue | 13(13) |
| Article # | 7309 |
| DOI | 10.3390/su13137309 |
| ISSN | 2071-1050 |
| Distribution license | Creative Commons Attribution 4.0 International |
| Website | https://www.mdpi.com/2071-1050/13/13/7309/htm |
| Download | https://www.mdpi.com/2071-1050/13/13/7309/pdf (PDF) |
|
|
This article should be considered a work in progress and incomplete. Consider this article incomplete until this notice is removed. |
Abstract
Effective and efficient data management is crucial for smart farming and precision agriculture. To realize operational efficiency, full automation, and high productivity in agricultural systems, different kinds of data are collected from operational systems using different sensors, stored in different systems, and processed using advanced techniques, such as machine learning and deep learning. Due to the complexity of data management operations, a data management reference architecture is required. While there are different initiatives to design data management reference architectures, a data management reference architecture for sustainable agriculture is missing. In this study, we follow domain scoping, domain modeling, and reference architecture design stages to design the reference architecture for sustainable agriculture. Four case studies were performed to demonstrate the applicability of the reference architecture. This study shows that the proposed data management reference architecture is practical and effective for sustainable agriculture.
Keywords: sustainability, agriculture, sustainable agriculture, data management, reference architecture, design science research
Introduction
The increase in food demand and its associated large ecological footprint call for action in agricultural production. [1] Inputs and assets should be optimized, and long-term ecological impacts should be assessed for sustainable agriculture. Decision-making processes on optimization and assessment need data on several inputs, outputs, and external factors. To this end, various systems have been developed for data acquisition and management to enable precision agriculture. [1] Precision agriculture refers to the application of technologies and principles for improving crop performance and environmental sustainability. [2] Smart farming extends precision agriculture and enhances decision-making capabilities by using recent technologies for smart sensing, monitoring, analysis, planning, and control. [1] Data to be acquired are enhanced by context, situation, and location awareness. [1] Real-time sensors are utilized to collect various data, and real-time actuators are used to fine-tune production parameters instantly.
In the late 2000s, Murakami et al. [3] and Steinberger et al. [4] pointed out a need for data storage and a processing platform for agricultural production. They utilized web services to send and receive data from a central web application. That web application received, stored, and processed data, and it provided the required outputs to its users or any other system. Similarly, Sørensen et al. [5] listed several data processing use cases to assist farmers’ decision-making processes. More recently, technologies such as the internet of things (IoT) make digital data acquisition, and hence smart farming, possible. [6] In recent years, many studies have been performed in the fields of smart farming and precision agriculture. [7,8,9,10,11,12,13] At the heart of many of those studies is Industry 4.0, which acts as a transformative force on smart farming processes. Industry 4.0-related technologies—namely IoT, big data, edge computing, 3D printing, augmented reality, collaborative robotics, data science, cloud computing, cyber-physical systems, digital twins, cybersecurity, and real-time optimization—are increasingly integrated into different parts of modern agricultural systems. [14]
To realize operational efficiency, full automation, and high productivity in these systems, different types of data are collected from operational systems using different sensors, stored in big data systems, and processed using machine learning and deep learning approaches. Traditional data management techniques and systems are not sufficient to deal with this scale of data, and as such, big data infrastructures and systems have been designed and implemented. To manage the complexity of this big data, many different aspects of data must be considered during the design of these systems. Different data management reference architectures have been designed to date. [15,16,17] To the best of our knowledge, none of these studies have focused on sustainable agriculture. There exist several practices for sustainable agriculture that can protect the environment, improve soil fertility, and increase natural resources. It is known that agriculture can affect soil erosion, water quality, human health, and pollination services. [18] As such, sustainable agriculture is crucial to minimize the negative effects of agricultural production. Sustainable agriculture requires an iterative process because each actor in the system has a different responsibility, and the success of this process is highly dependent on the success of each actor.
The goal of this study is to present a data management reference architecture for supporting smart farming, sustainable agriculture, and other domains. The study builds on the recent developments in data management and processing, i.e., big data, machine learning, and data lakes. We designed a data management reference architecture for sustainable agriculture and evaluated it using several case studies. Domain scoping, domain modeling, and reference architecture design stages were followed to create the reference architecture. Based on the reference architecture, we can design different application architectures. During the validation stage of this study, using different case studies obtained from the literature, we have shown the applicability of our reference architecture as a novel data management reference architecture for sustainable agriculture.
The structure of this paper follows the outline proposed by Gregor & Hevner [19] for design science research. The next section summarizes the research method adopted in this study, followed by the definition and structuring of the problem by analyzing the existing literature. We then present the related reference architecture studies and explain the solution design process and the reference architecture obtained. That is followed by the evaluation of the reference architecture by deriving application architectures from it based on some requirements from the sustainable agriculture domain. The penultimate section discusses the results, and the final section provides conclusions and plans of future work.
Research method
The design science research (DSR) method proposed by Hevner et al. [20] was followed in this study. DSR is a problem-solving paradigm and seeks to create artifacts through which information systems can be effectively and efficiently engineered. [20] These artifacts are designed to interact with a problem context to improve something in that context. [21]
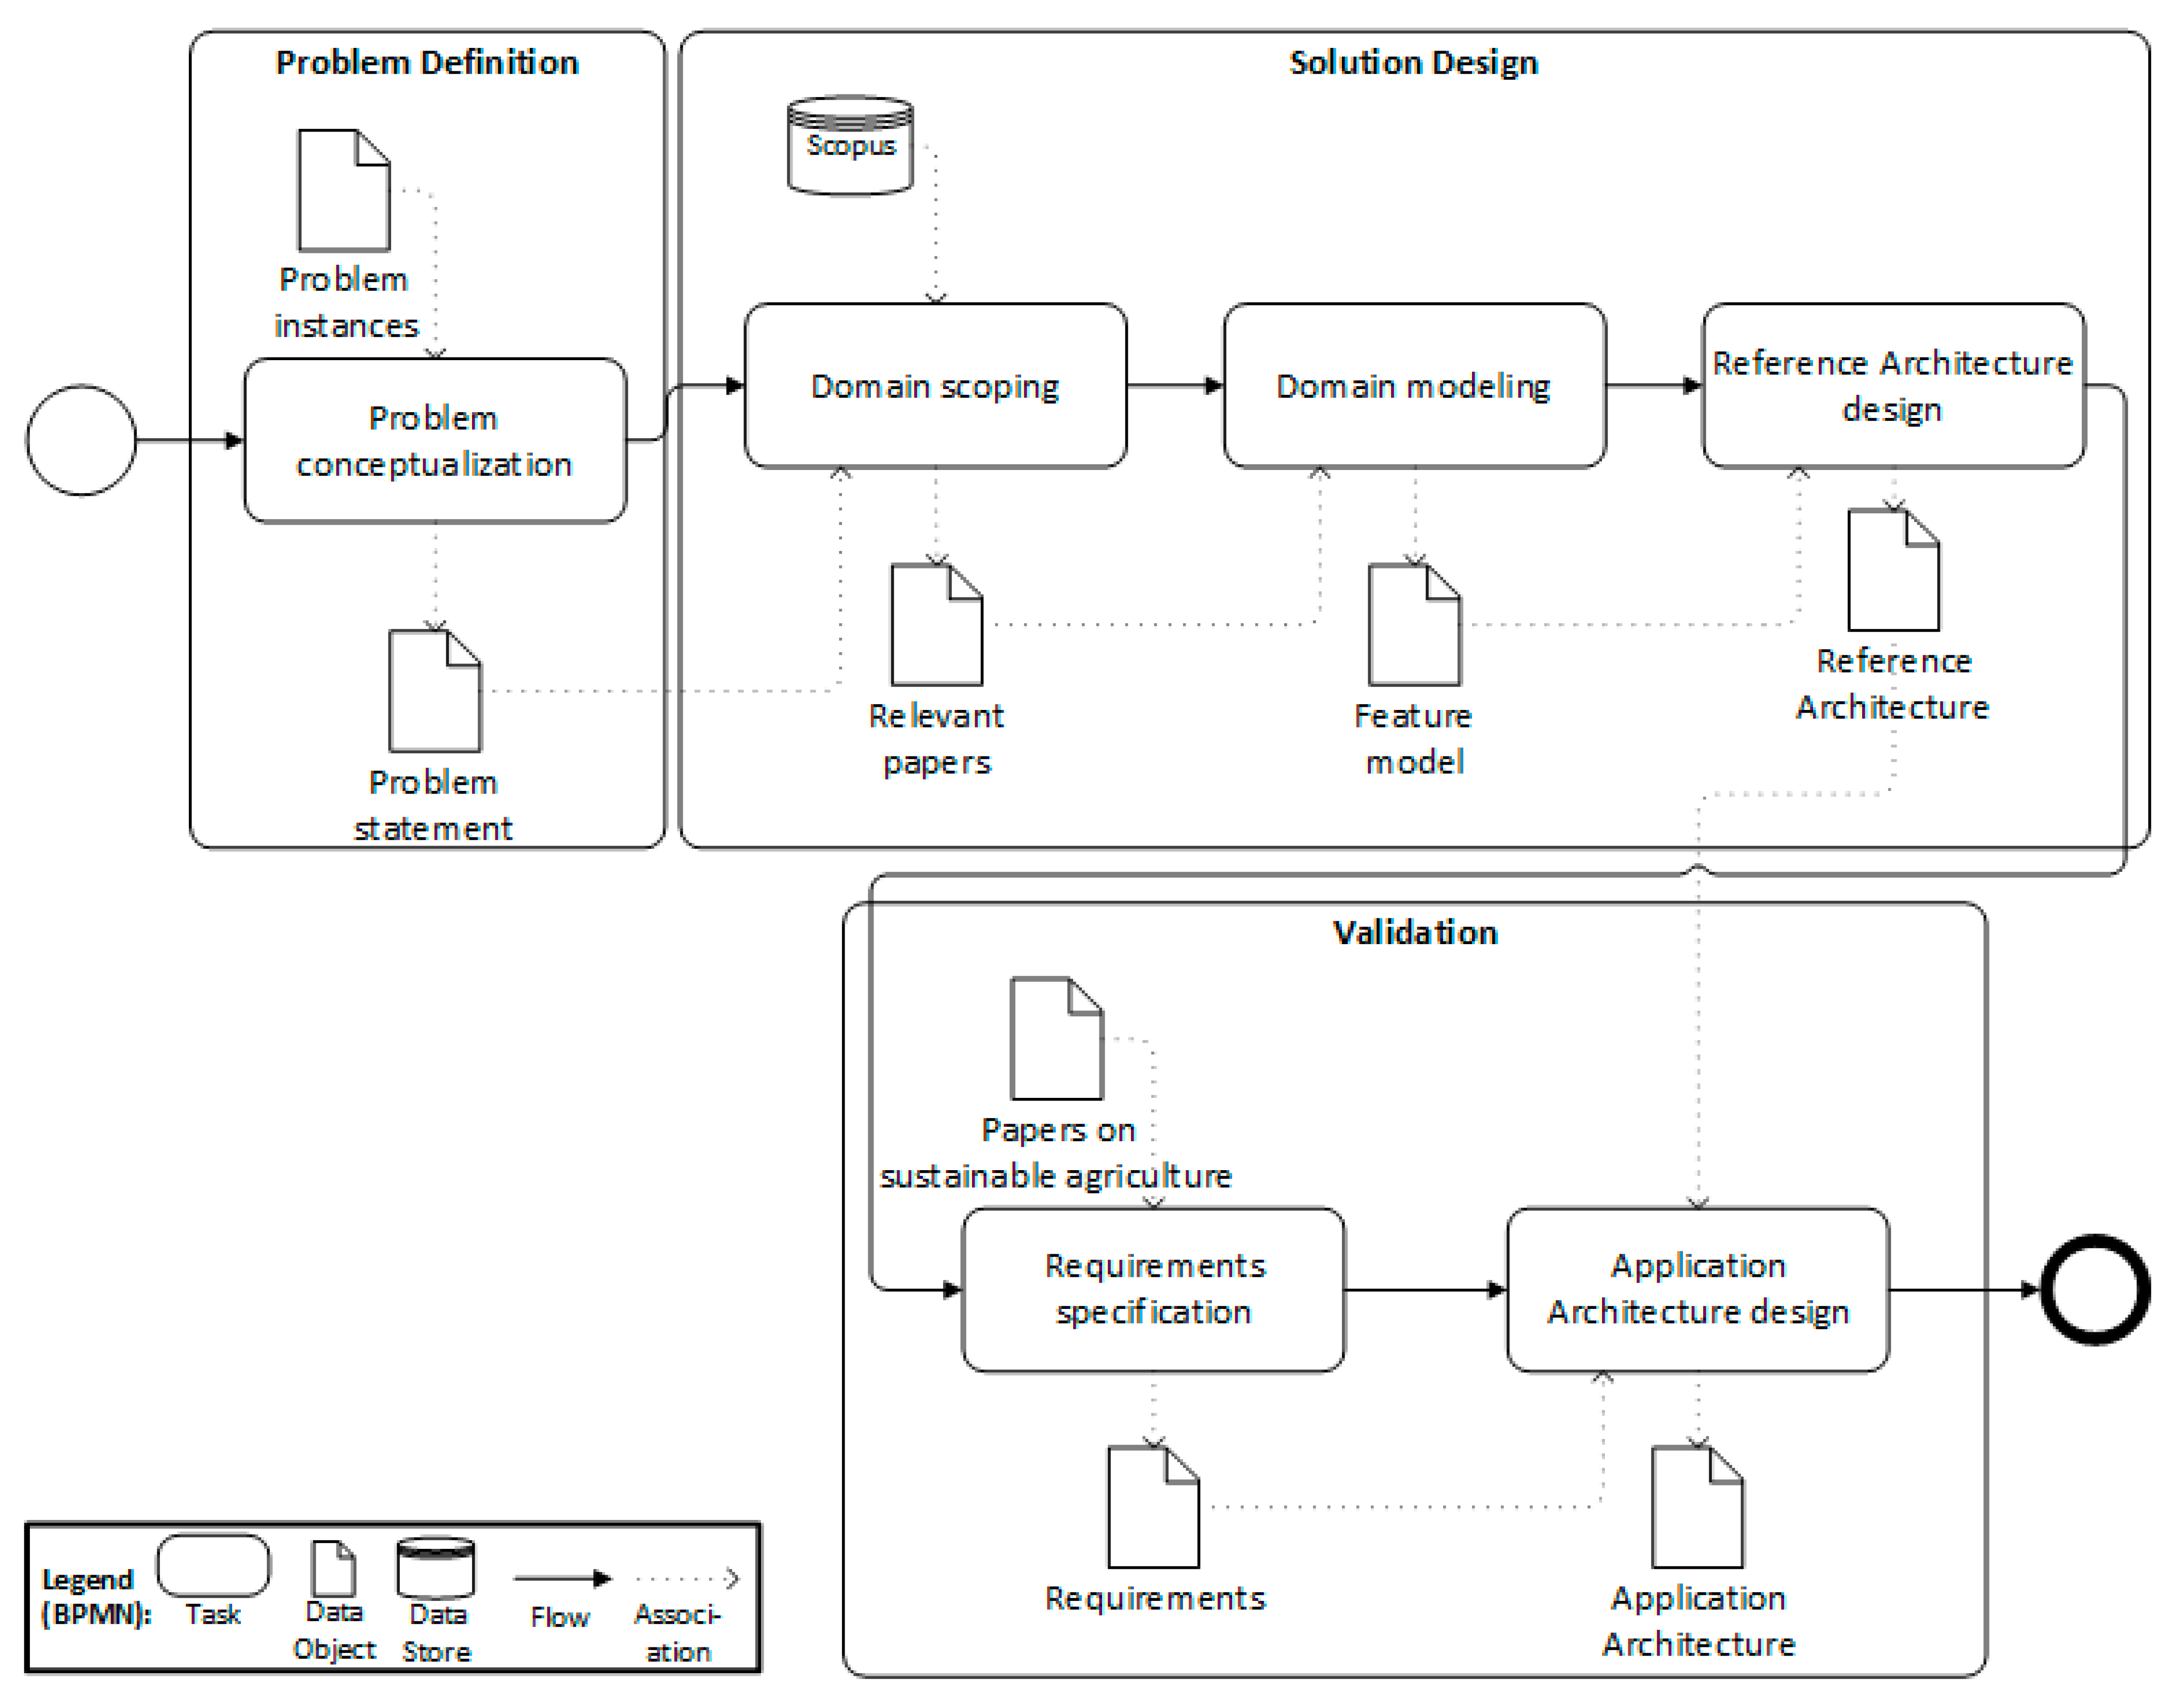
The activities and the artifacts span two significant dimensions, i.e., problem-solution and theory-practice dimensions. [22] Figure 1 shows the research method used in this study. The first step was the identification of some problem instances occurring in practice and sharing similar aspects. These problem instances were analyzed, and a problem statement was formed using theoretical concepts from the literature. A conceptual solution, i.e., an artifact or artifacts, was designed by following a systematic approach. Domain analysis was used to derive and represent domain knowledge to be used for solution design. Domain analysis involved domain scoping and domain modeling activities. [23] Domain scoping refers to the identification of relevant knowledge sources to derive the key concepts of the solution. [24] To this end, several searches were conducted on the Scopus database using different search strings. Domain modeling aims at unifying and representing the domain knowledge obtained from relevant sources. The feature model was used to represent the output of domain modeling. [25] A reference architecture was designed as a conceptual solution.
|
To evaluate the reference architecture, requirements were specified using recent literature on sustainable agriculture. [26,27,28,29,30] Based on these requirements, a concrete application architecture was derived using the reference architecture.
In accordance with DSR and the research method described here, the following sections describe problem definition, design of a solution, and the evaluation of the solution.
Problem definition
This study was motivated by three use cases involving different data management requirements to support sustainable agriculture. The following three use cases were used for understanding and conceptualizing the problem:
- Case 1: Satellite images (e.g., Sentinel-2 data) can be obtained from a data provider. These images can be processed to derive plant parameters such as Leaf Area Index (LAI), biomass, and chlorophyll content during the growing season. [31] Afterward, the current growth status and development of cultivated crops at each location in the field can be deduced. [32] This information can be used for site-specific plant protection and fertilization measures [33], which support sustainable agriculture.
- Case 2: Harvested crop volume can be quantified and recorded in real time using numerous sensors. [34] Various parameters such as "quantity per hectare" and "flow" can be calculated, and crop productivity maps can be built. [34] Farmers can use these maps to optimize inputs such as fertilizers, pesticides, and seeding rates, resulting in an increase in yields. [35]
- Case 3: Machinery process data such as speed, angle, pressure, and flow rate can be obtained through sensors in tractors and equipment. [4] Machine, worker, field, and time slot data can be stored, and basic statistics like minimum, maximum, and standard deviation can be computed. [4] As a result, automated documentation of the production process and site-specific work can be attained. [4]
Table 1 summarizes the above-mentioned cases from a data management perspective. Similar to many cases in various domains, at a high level, digital data are produced and fed to a software system to be processed and stored. Such a system can be designated a data management platform and produce outputs that can lead to better business outcomes. As per the first case, satellite images can be processed via computer vision algorithms to drive plant parameters such as Leaf Area Index (LAI), biomass, and chlorophyll content, which can in turn be used to track the current growth status of cultivated crops and support decision-making activities.
| ||||||||||||||||||||
Solution design and artifact description
This section starts with a summary of related reference architecture studies and then presents the three steps of the solution design phase, namely domain scoping, domain modeling, and reference architecture design.
Related reference architecture studies
Before presenting our reference architecture, we discuss the available reference architectures in the literature. First, while Nikkilä et al. [36] and Kaloxylos et al. [37] presented architectural aspects of Farm Management Information Systems (FMISs), they did not propose a reference architecture, which limited the utility of their research for our purposes. However, Tummers et al. [17] designed a reference architecture for FMISs. They first identified the stakeholders and their concerns. Afterward, a feature model for FMISs was created. The reference architecture was designed and represented via context and decomposition views. Three case studies were performed to show the applicability of the proposed reference architecture.
Köksal & Tekinerdogan [6] proposed a reference architecture for IoT-based FMISs. They proposed an architecture design method and showed that the approach is practical and effective. Their architecture included data acquisition, data processing, data visualization, system management, and external services. Each main feature consisted of several sub-features. For instance, the data processing feature involved sub-features like image/video processing, data mining, decision support, and data logging. They used decomposition, layered, and deployment views to document the reference architecture. For deriving a concrete FMIS architecture, their reference architecture can thus be used.
Kruize et al. [38] proposed a reference architecture for farm software ecosystems. Farm software ecosystems aim to fulfill the needs of several actors in the smart farming domain. In that respect, their scope is much wider compared to FMISs. The farm software ecosystem reference architecture mainly focused on the problem of bringing various software and hardware components together to form a platform for multiple actors.
To the best of our knowledge, there is no other study that presents a data management reference architecture for sustainable agriculture. Although some of the previous studies mention several data-related components, a complete architectural view of managing data for sustainable agriculture was missing. As such, our reference architecture study aims to fill this research gap.
Domain scoping
The Scopus database was used as the knowledge source for domain scoping. To identify the search keywords, it was crucial to understand the recent factors driving reference architectures for data management. The concept of "big data" has emerged to highlight challenges of data management, including volume, velocity, and variety. [39] Machine learning is another hot research topic, which tries to acquire knowledge by extracting patterns from raw data [40,41] and solve problems using this knowledge. The concept of a "data lake" is another to have recently emerged, which addresses the shortcomings of data warehouses. A data lake can be defined as a data management platform that allows the storing of both structured and unstructured data, unlike data warehouses that handle only structured data. This type of platform is designed to enable big data processing, real time analytics, and machine learning.
Based on these recent trends, four search strings were used to form the initial paper pool. The phrase “reference architecture” was combined with four phrases representing the recent trends in data processing for sustainable agriculture (i.e., "data management," "big data," "machine learning," and "data lake"). The search keywords were kept general to have a high recall and relatively low precision. Although this required more effort from the authors, obtaining a broader initial set of papers decreased the possibility of missing relevant studies.
The database search on Scopus was conducted in February 2021. No criterion was set for the publication date. A total number of 270 papers was obtained for the pool of candidate papers. All the results were combined in an Excel sheet, which included useful information about the papers such as title, abstract, keywords, and publication date, which are used in further steps.
To identify the relevant papers for designing a reference architecture, we applied the exclusion criteria to the papers obtained from Scopus. Those papers that were duplicated, not written in English, or lacking full text were filtered out. The papers involving a reference architecture to process data in any business domain were included. Seven papers included a reference architecture for data processing, along with the essential components.
The data extraction phase followed the selection of relevant papers. The components of the data processing architecture listed in the papers were extracted and recorded in an Excel sheet. These components were unified by reading the definitions presented in the papers. Table 2 shows the unified list of the components and the source papers where each component was identified.
| ||||||||||||||||||||||||||||||||||||||||||||||||||||||||||||||||||||||||||||||||||||||||
All the papers address three main components that deal with collecting data from various sources (i.e., acquisition), processing data to provide some value to data consumers (i.e., analysis), and addressing persist data (i.e., storage). Pääkkönen and Pakkala [47] identified information extraction as a component to extract structured data from unstructured and semi-structured data, such as email or images. Data quality management is another vital component to handle data quality problems. Data received from various sources should be integrated for further analysis. Security and privacy components are used to protect data from unauthorized data and for proper handling of personal data. Metadata management refers to the creation and storage of metadata to document the meaning of data. The replication component ensures redundant storage of data sources to provide better data availability in case of technical problems, and the archiving component is responsible for storing cold data for future possible needs.
Domain modeling
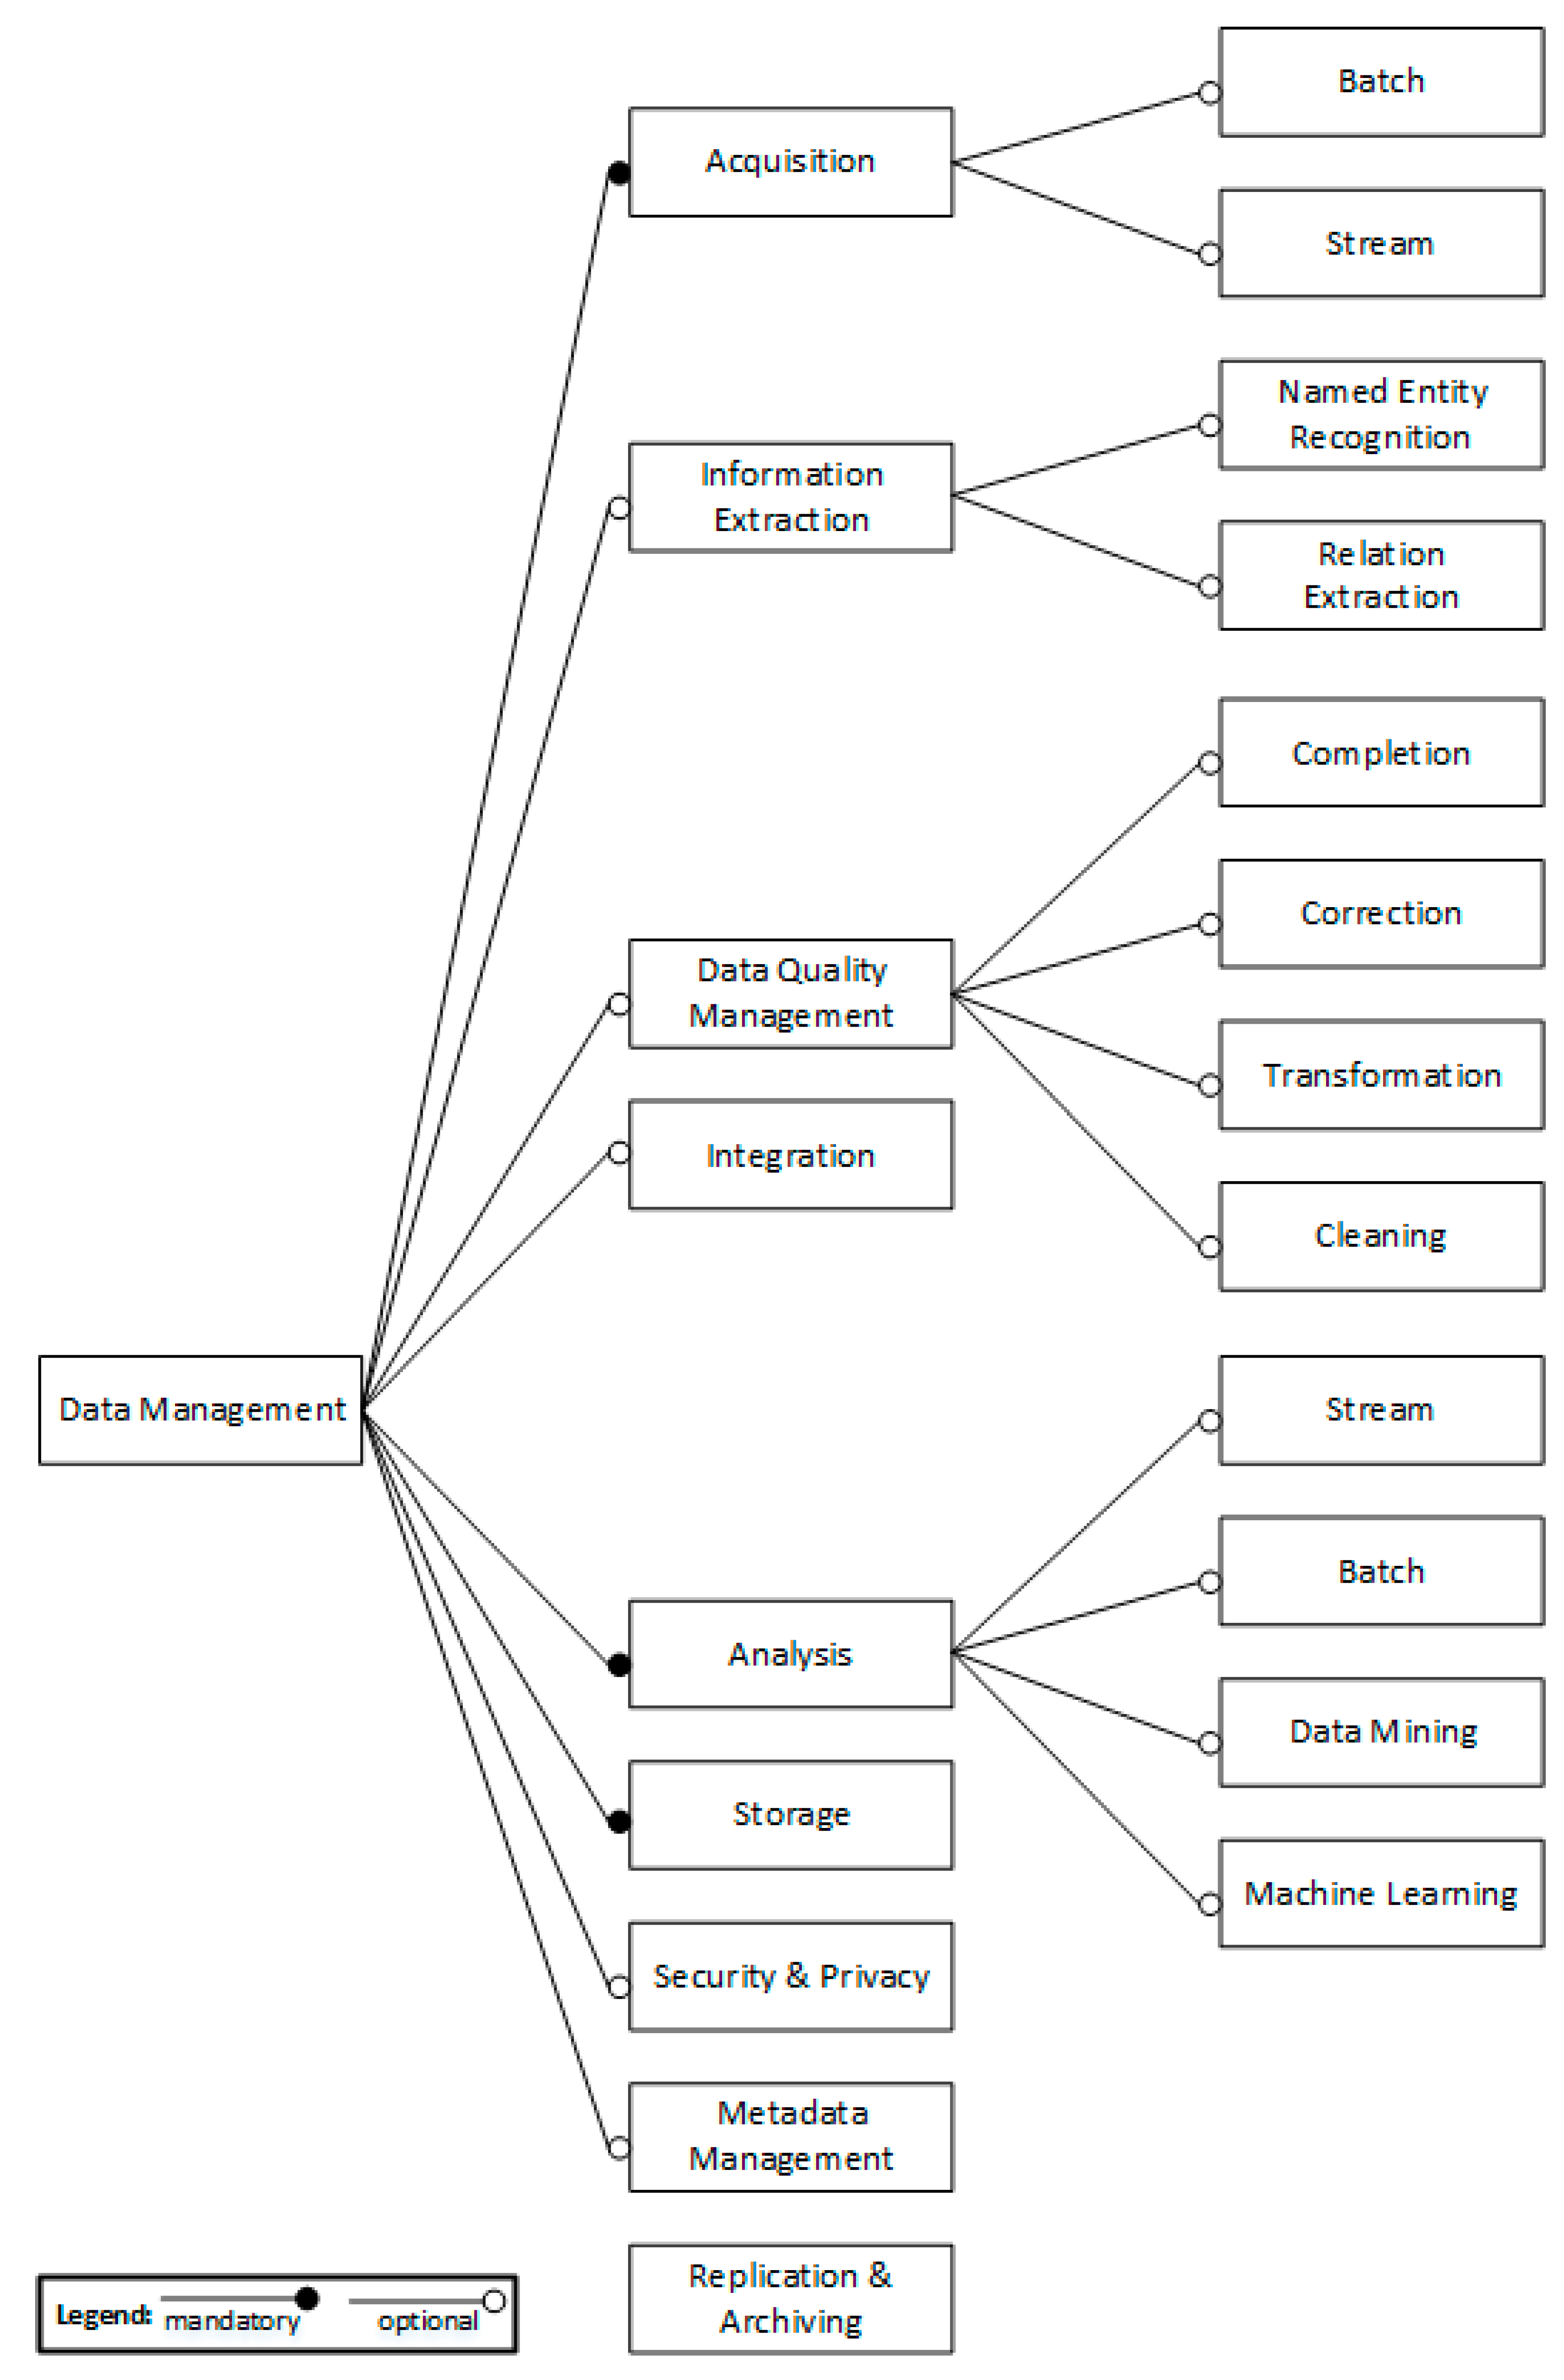
Feature modeling is one of the approaches to represent domain knowledge in a reusable format. [24,25] Figure 2 shows the feature model, which is derived from the unified list of components presented in Table 2. A feature diagram can include mandatory and optional features. Three components identified by all papers are treated as mandatory features. The remaining features are optional and can be used depending on business requirements.
|
Data need to be onboarded to a data platform for further processing and storage, a process referred to as the ETL (extract, transform, and load) process in traditional data warehousing architectures. [48] Such architectures possess a pre-defined data schema and data are loaded based on this schema. Data ingestion refers to the process of transferring data from providers to a platform for further processing. [49] The umbrella term for such processes is "data acquisition." Data can be acquired in batches at regular intervals or in real time (or in near real time) as streams. A component acquiring data streams should be able to handle data with high velocity. [50]
Information extraction is intended for obtaining useful information from unstructured and semi-structured data. [51] Unstructured and semi-structured data may include natural language text, image, audio, and video. Several tasks performed under information extraction include classification, named entity recognition, relationship extraction, and structure extraction. [16,48,52] Named entity recognition (i.e., named entity identification) aims at identifying and classifying named entities in unstructured or semi-structured texts into predefined categories such as a person, organization, or location. For instance, Gangadharan and Gupta [53] extracted names of crops, soil types, crop diseases, pathogen names, and fertilizers from documents on agriculture. Relation extraction is the task of detecting and classifying predefined types of associations among recognized entities. [52] For example, relationships among crop diseases and locations can be extracted. The sub-features for information extraction can be expanded depending on domain-specific requirements.
Data quality management refers to handling data quality problems that may arise due to several reasons [48], including missing, incorrect, unusable, or redundant data. [54] To address these main data quality problems, missing data can be completed, incorrect data can be corrected, unusable data can be transformed, and redundant data can be cleaned.
In general, data management platforms acquire data from multiple sources that usually involve differences in data models, schemas, and data semantics. [55] Data integration aims at combining heterogeneous data and providing a unified view of these data. [56] One technique for data integration is schema mapping, which refers to conveying the data schemas of multiple data sources into one global common schema. [57]
Data are analyzed to obtain some value from them. Results of analysis may provide insights to users and constitute some intermediate output for further processing. [48] Stream analysis encompasses the timely processing of flowing data and generates required outputs. For instance, an environmental monitoring system can process raw data coming from sensor networks to identify critical cases. [58] On the contrary, batch analysis is conducted on static datasets. [59] Data mining and machine learning, including deep learning algorithms, may be utilized to produce deeper analyses. [60,61]
Storage is a feature supporting other features and refers to the temporary and persistent storage of data. To manage the increased volume, velocity, and variety of data [39], different types of data stores are released. Therefore, the storage feature involves various database management systems (e.g., Microsoft SQL Server, Oracle, PostgreSQL, or MongoDB) implementing different data models such as relational or nonrelational (or NoSQL).
The security and privacy feature addresses authentication and authorization, access tracking, and data anonymization. [48] Several standards, guidelines, and mechanisms can affect the realization of this feature, such as data encryption standards and mechanisms, access guidelines, and remote access standards. [62]
Metadata management is related to planning, implementation, and control activities to enable access to metadata. [62] This feature mainly involves capabilities related to collecting and integrating metadata from diverse sources and providing a standard way to access these metadata. [62]
The replication feature manages the storage of the same data on multiple storage devices. [62] While having replicated instances of data support remain highly available, data consistency may become an issue to deal with. The archiving feature addresses the movement of infrequently used data onto media with a lower retrieval performance. [62]
Reference architecture design
Based on the abstraction derived from the three cases presented prior, Figure 3 shows the context diagram of a data management system. The context diagram shows the overall purpose of the system and its interfaces with the external environment. [63] At a very high level, some data providers send data to a data management system. These may be humans entering data through a graphical user interface (GUI) or external systems providing input data to be processed. Data obtained from data providers are stored, processed, and served to data consumers based on their requirements.
|
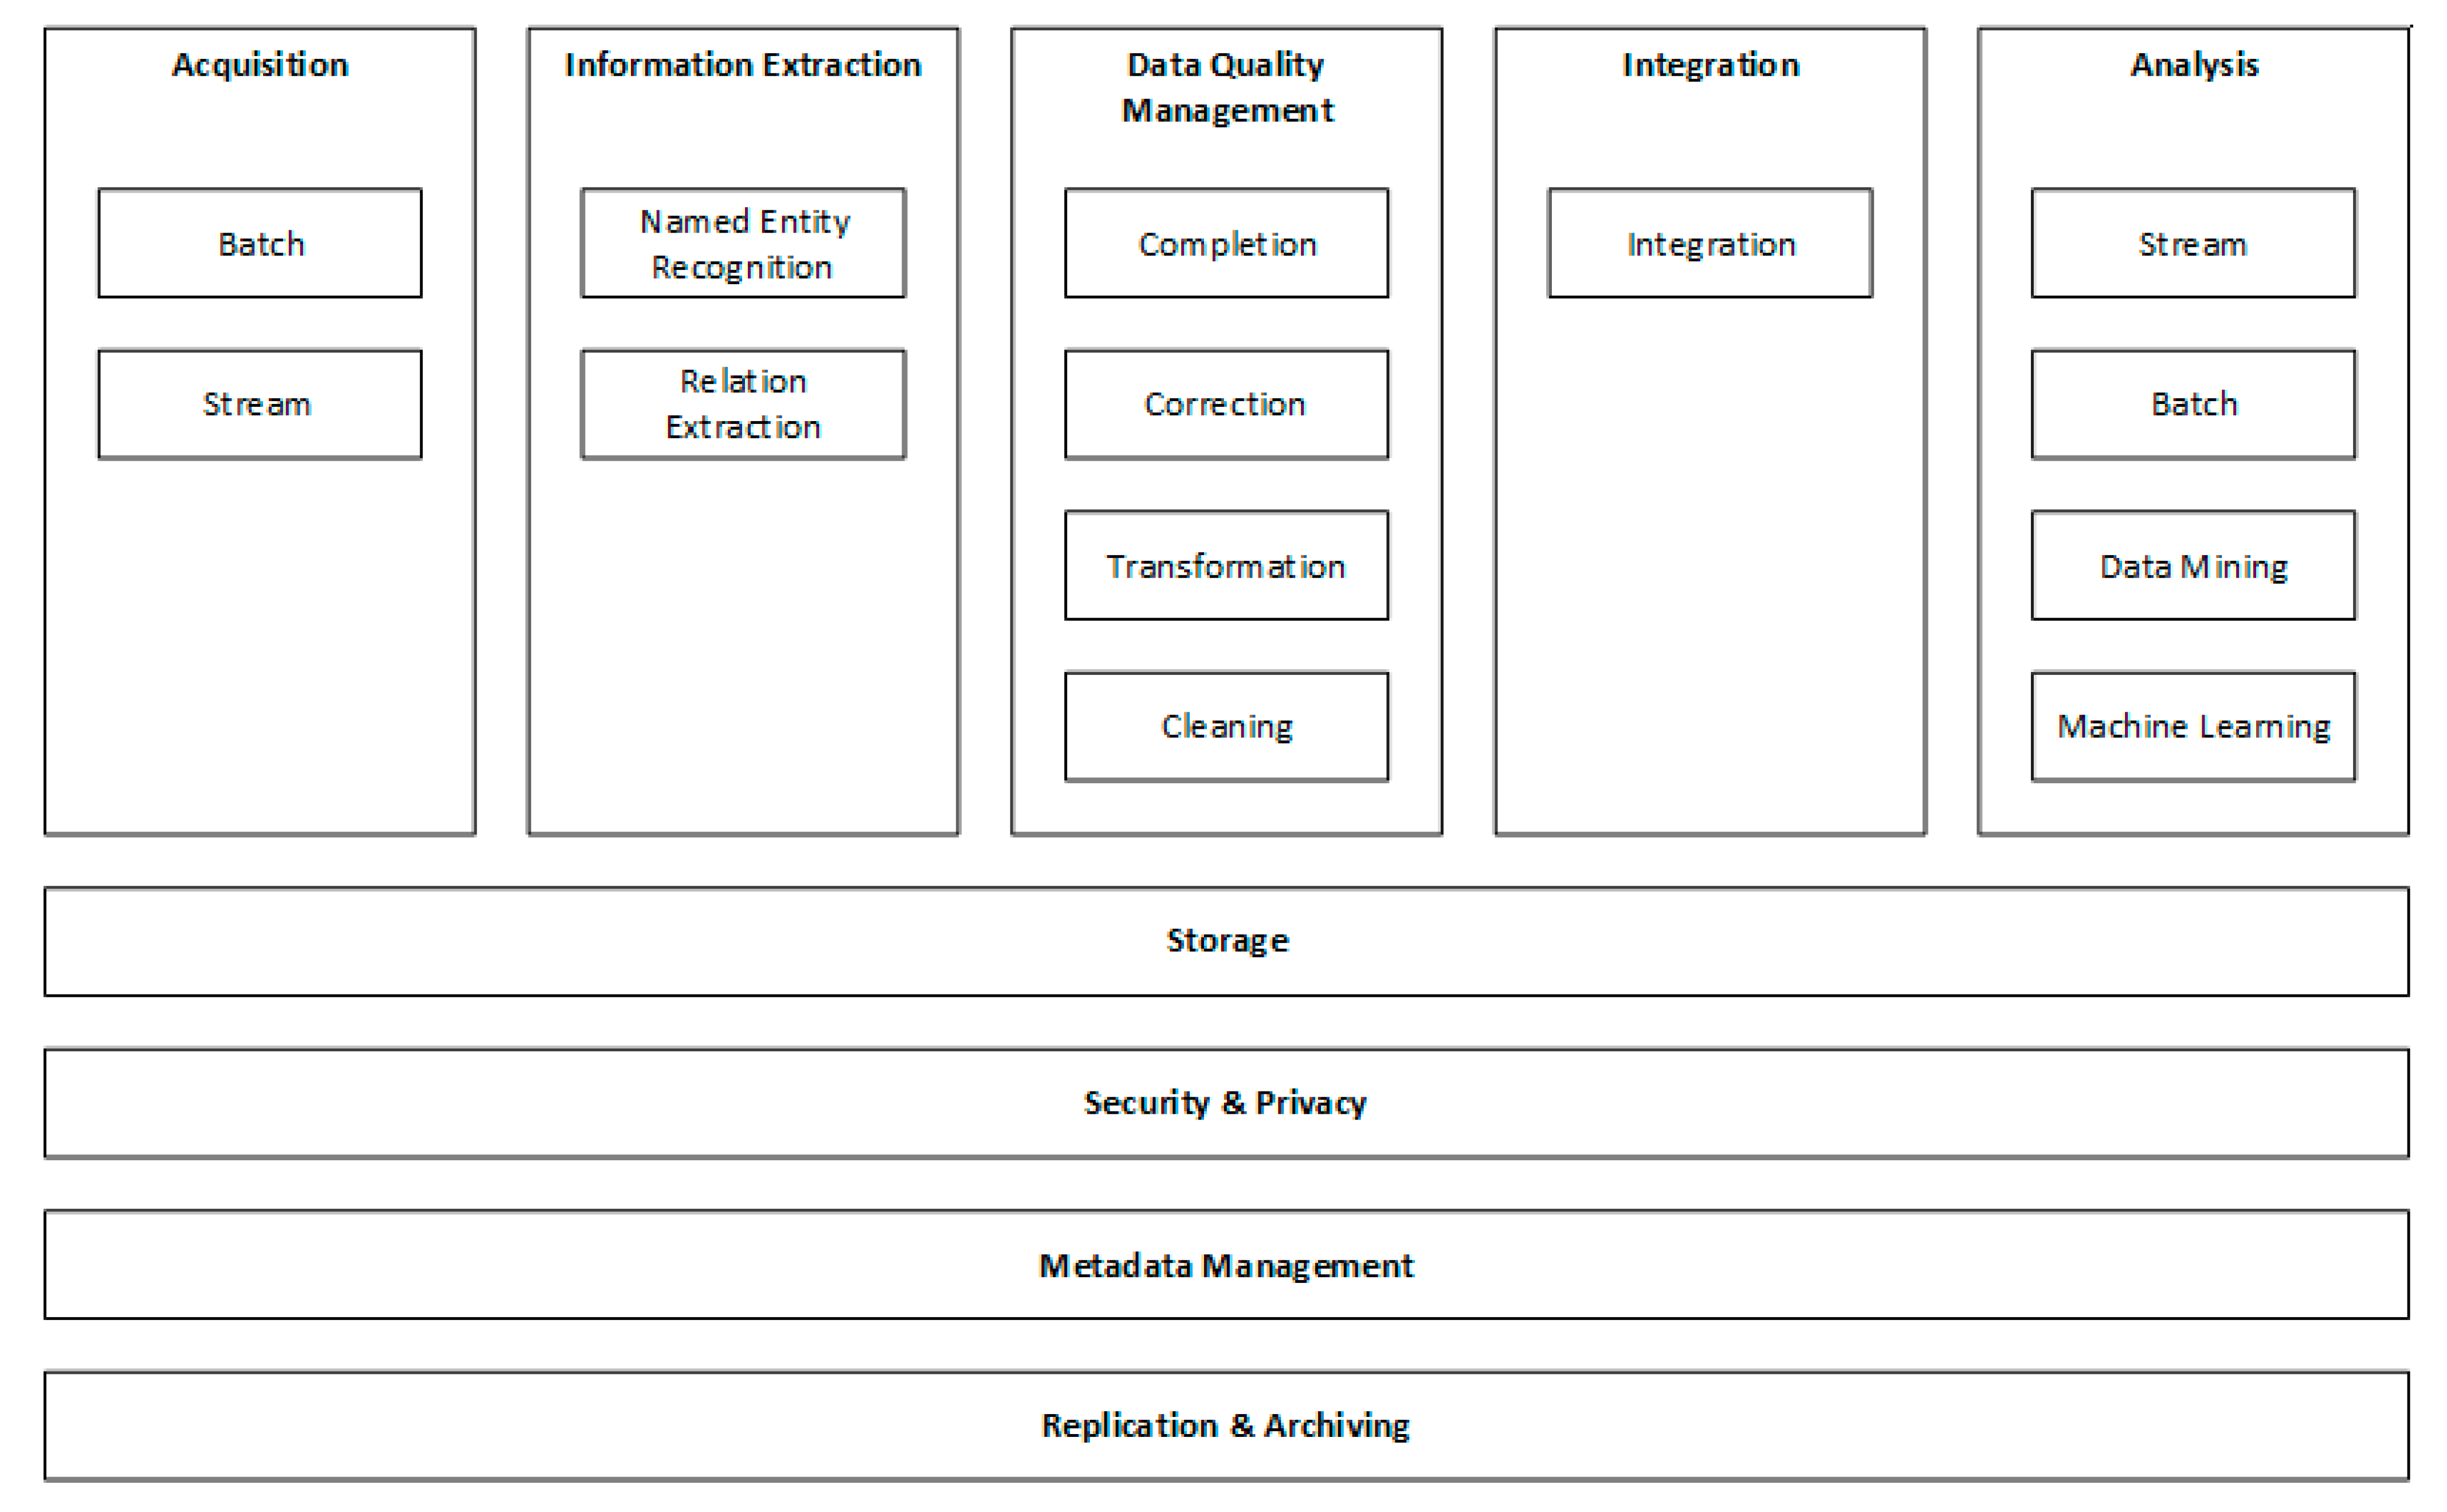
Figure 4 shows the decomposition view of the data management reference architecture proposed for data processing.
|
Acquisition components are responsible for onboarding data to the data management platform for further processing. Useful information such as named entities and relations can be extracted from the acquired data. Quality problems can be resolved by completing, correcting, transforming, and cleaning the acquired data to obtain more accurate results from analyses. The data obtained from various sources need to be integrated to end up with better and richer insights. Various components can be used to analyze data to support decision-making. The storage component handles different modes of storing data. The security and privacy component is needed to protect data from unauthorized access. Data on the description of acquired data, are handled by the metadata management component. Replication may be needed for high availability. An archive component is usually required to manage the process of archiving unused historical data.
The next section presents how an application architecture can be derived from the reference architecture based on the requirements in sustainable agriculture.
Validation
To evaluate the reference architecture, a set of requirements was extracted from recent papers on sustainable agriculture. [26,27,28,29,30] The high-level requirements address issues on crop yield prediction [27], irrigation management [28], real time variable-rate fertilization [30], and exotic animal infectious diseases monitoring. [26] These diverse high-level requirements address various data management aspects in sustainable architecture.
Sustainability is a long-term, high-level goal involving several aspects and sub-goals. Generally, there is a gap between software requirements and sustainability goals. While software requirements tend to be more tangible, sustainability goals tend to be more intangible. Therefore, a tangible decomposition of sustainability and the ability to map it to concrete software requirements are required to monitor the achievement of sustainability goals. [64]
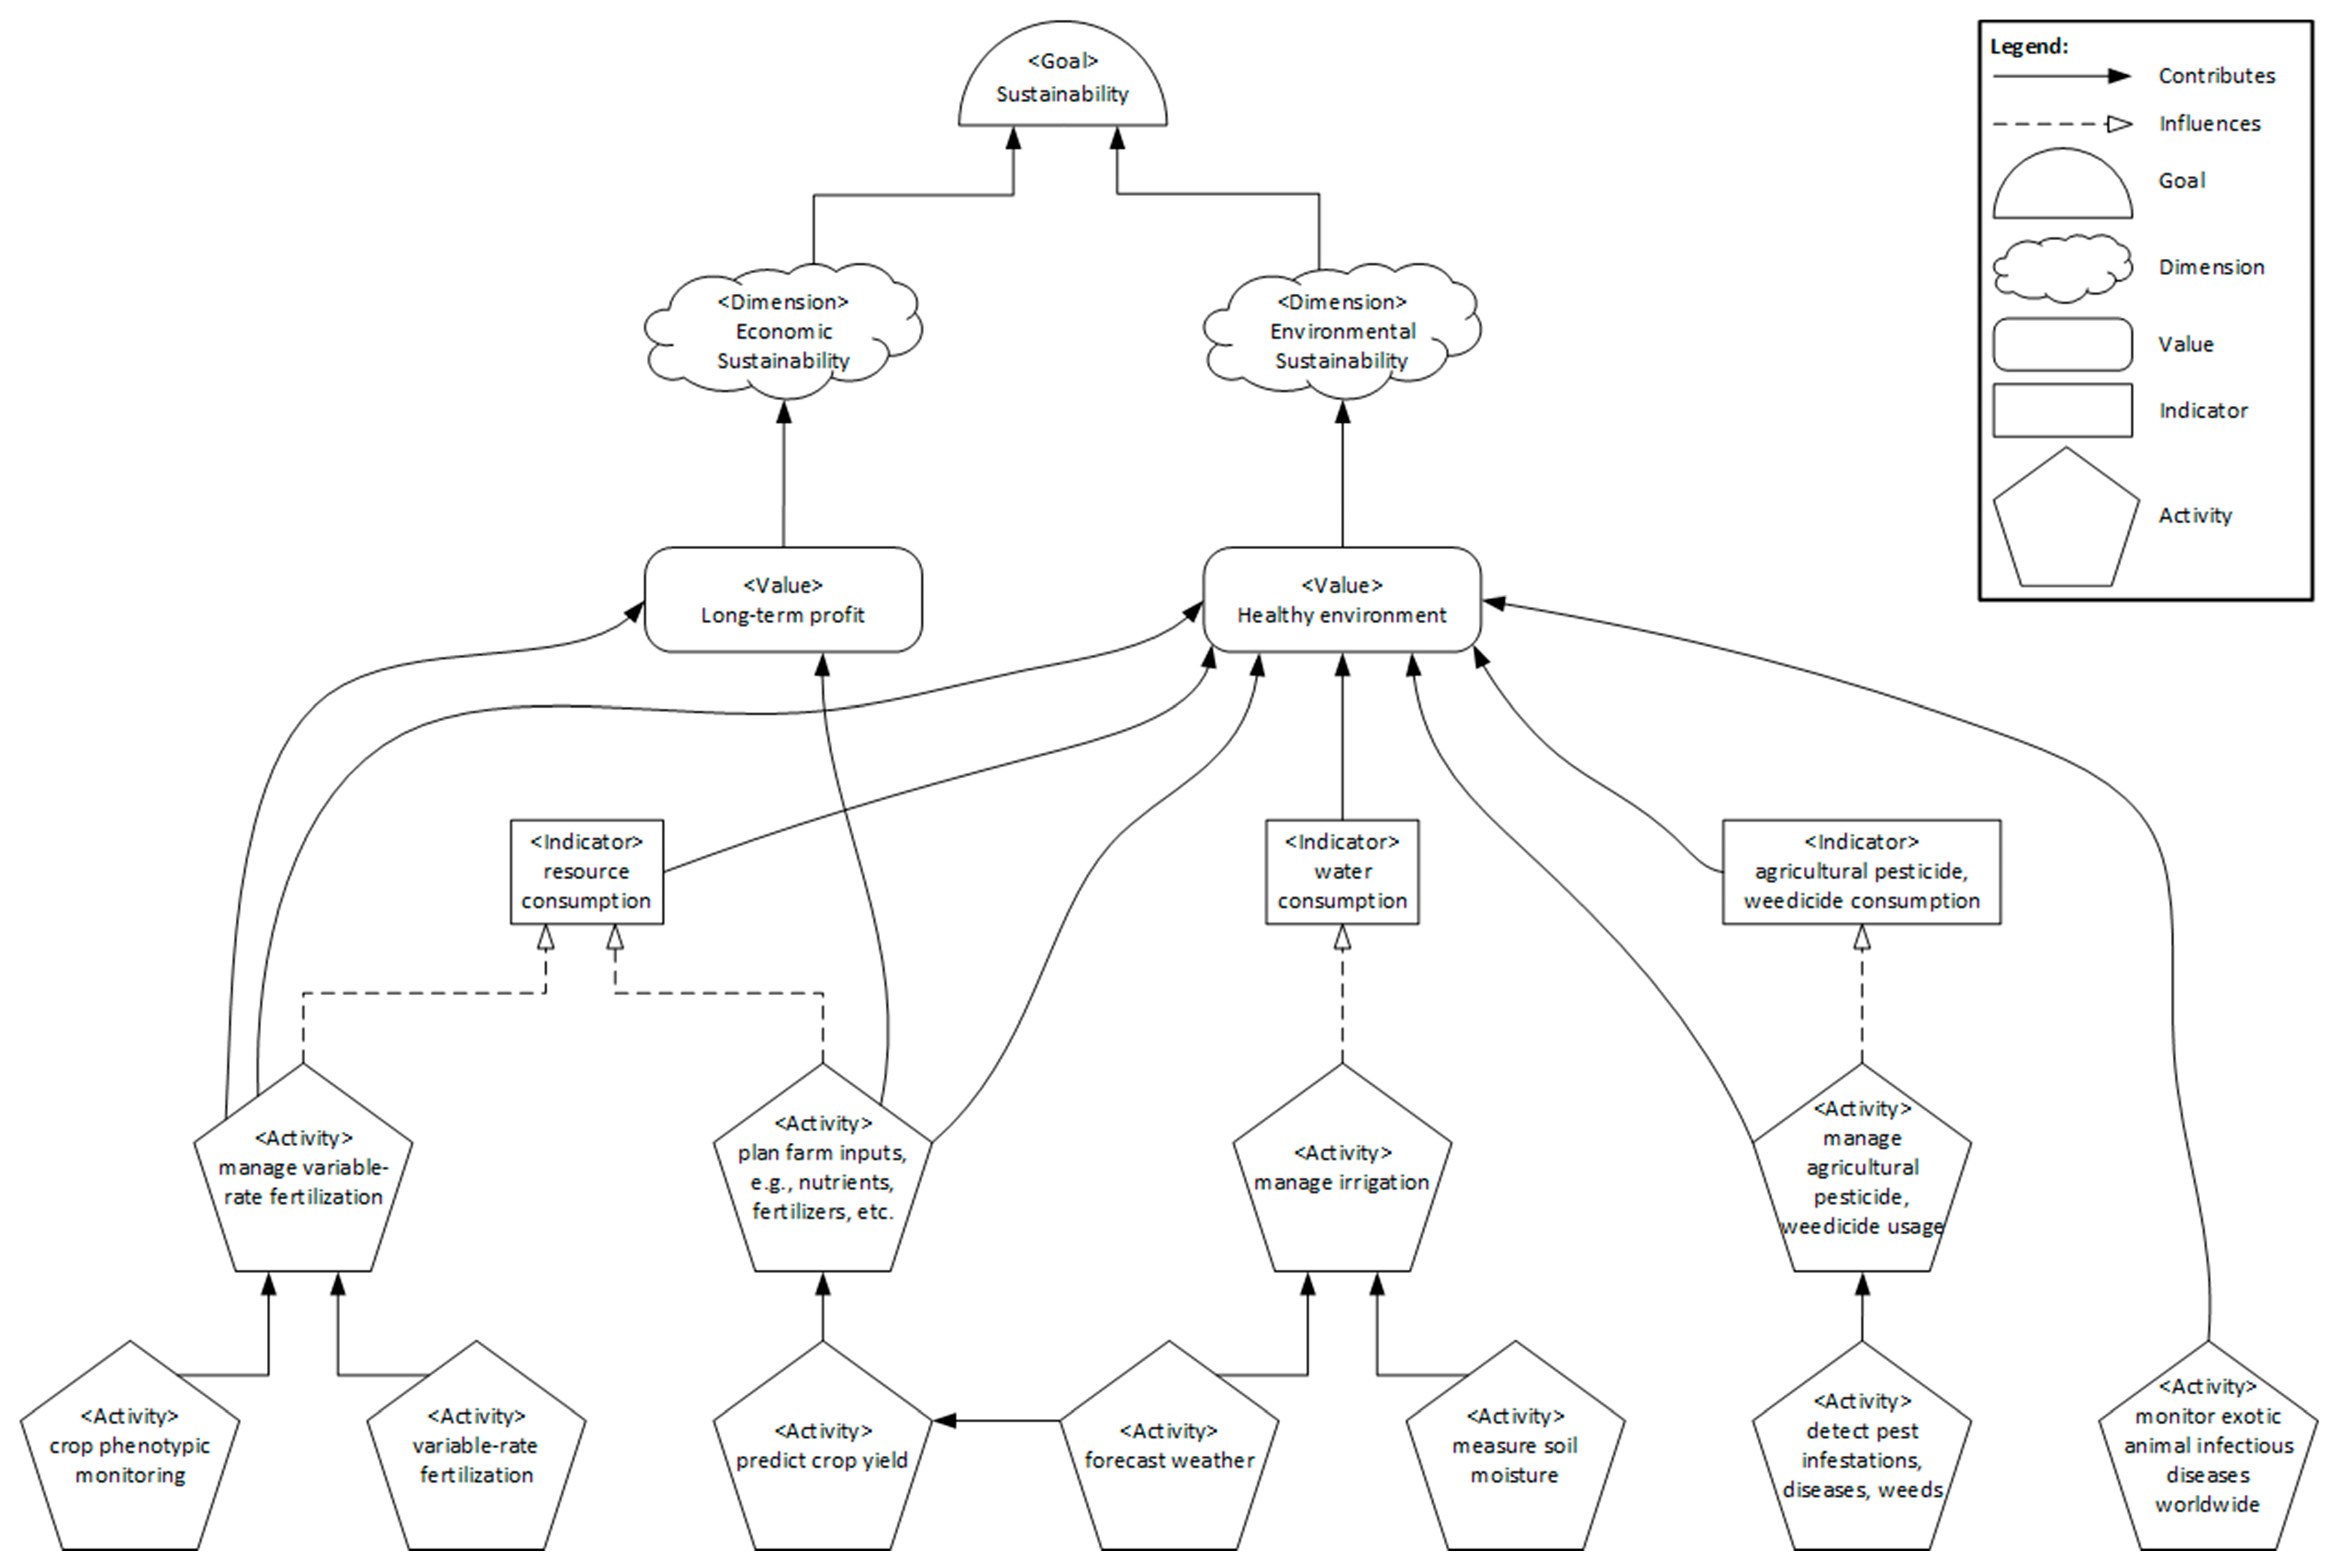
Penzenstadler and Femmer proposed a reference model to show the dimensions of sustainability (i.e., individual, social, economic, environmental, and technical) and map them to high-level software requirements. [64,65] Figure 5 shows the high-level software requirements obtained from the literature and how they are mapped in the sustainability model proposed by Penzenstadler & Femmer. [64,65]
|
The goal of sustainability has several dimensions such as economic and environmental. There are moral and natural goods that are perceived as an expression of a specific dimension. [64] Long-term profit and healthy environment are two examples of values contributing to economic and environmental dimensions, respectively. Indicators are qualitative or quantitative metrics that express a specific degree or score regarding a value. [64] Consumption amounts of resources, water, agricultural pesticide, and weedicide are examples of indicators. Activities are measures taken to contribute to values [64] and can have different levels of granularities, which are associated with each other. Lower-level activities such as crop phenotypic monitoring, shown in Figure 5, can contribute to a higher-level activity such as variable-rate fertilization management. Lower-level leaf activities, such as predicting crop yield, shown in Figure 5, can be treated as the high-level software requirements (e.g., high-level use cases or epics) against which one or more system features are developed.
Components of the data management reference architecture
The components of the data management reference architecture used to realize each high-level software requirement are described as follows.
Crop yield prediction is an essential task for growers and farmers to decide on what and when to grow. [66] However, it is extremely challenging due to numerous complex factors [67]. To overcome this challenge, researchers started to use machine learning algorithms to predict crop yield based on various input variables. [27] Mohsen et al. [27] suggest using weather, soil, plant population, and planting process data. These historical data are extracted from various sources such as surveys [68,69] and stored (acquisition: batch). Unusable data such as rows with missing values are removed (cleaning) and some of the values are normalized (transformation). The data obtained from different sources are combined (integration). Several machine learning models are built through experimentation (machine learning: model development). One of the obtained machine learning models that exhibits a satisfactory performance is deployed (machine learning: model deployment). The performance of the deployed model should be monitored for a possible performance degradation. [70,71] When the performance does not meet expectations, a new machine learning model should be trained and deployed.
Wireless sensor networks using IoT technologies can be utilized for irrigation management. [28] Sensors can measure real-time environmental data such as soil moisture in predefined periods and send these data to the data storage over the internet (acquisition: stream). [72] A weather forecast can be obtained from a data provider (acquisition: batch) to manage irrigation by considering the conditions that affect the irrigation process, such as rain or strong winds. [72] The measurement and forecast data are combined (integration) by considering time dimension, i.e., data obtained from different sources must fit into the same temporal window. [73] Based on the combined data, irrigation decisions can be drawn based on predefined rules [28] or a prediction model (machine learning). [73] The data on this decision can be sent to an actuator to control irrigation.
Crop phenotypic information can be used to enable real-time variable-rate fertilization. [74,75] The predictors of phenotypic information involve crop three-dimensional size, biomass, and vegetation index, as well as other indicators. [30] These data can be acquired using aviation-based [76,77] and ground-based [78] approaches. Data obtained through sensors mounted to unmanned aerial vehicles (UAVs) [79], or ground-based phenotypic platforms with a series of sensors and a GPS [80,81] can be ingested into a data management platform (acquisition: stream). To obtain accurate predictions of crop phenotypic information, it is necessary to combine multi-source sensor data such as color, depth, and spectral data with environmental and crop physiology data [30] (integration) and develop machine learning models (machine learning: model development). Those models need to be deployed (machine learning: model deployment) and used for real time variable-rate fertilization. As a result, improvements in the level of fertilizer utilization efficiency enable environmental and economic sustainability benefits by maximizing crop output and minimizing fertilizer input. [30]
Exotic animal infectious diseases are considerable threats to global health security and economic stability. [26,82] One of the vital sources for detecting signals of disease is online news platforms. Data can be collected from platforms such as Google News (acquisition: batch) and stored for further analysis (storage). The named entities such as location, date, disease, hosts, and number of cases can be extracted using Natural Language Processing (NLP) techniques [26] (information extraction: named entity recognition). In addition, predefined types of relationships among the recognized entities can be detected (information extraction: relation extraction). As an example, the sentence “12 pigs have been infected by African swine fever in Poland” can provide the following entities [26]: number of cases = 12; host = pig; disease = African swine fever; location = Poland.
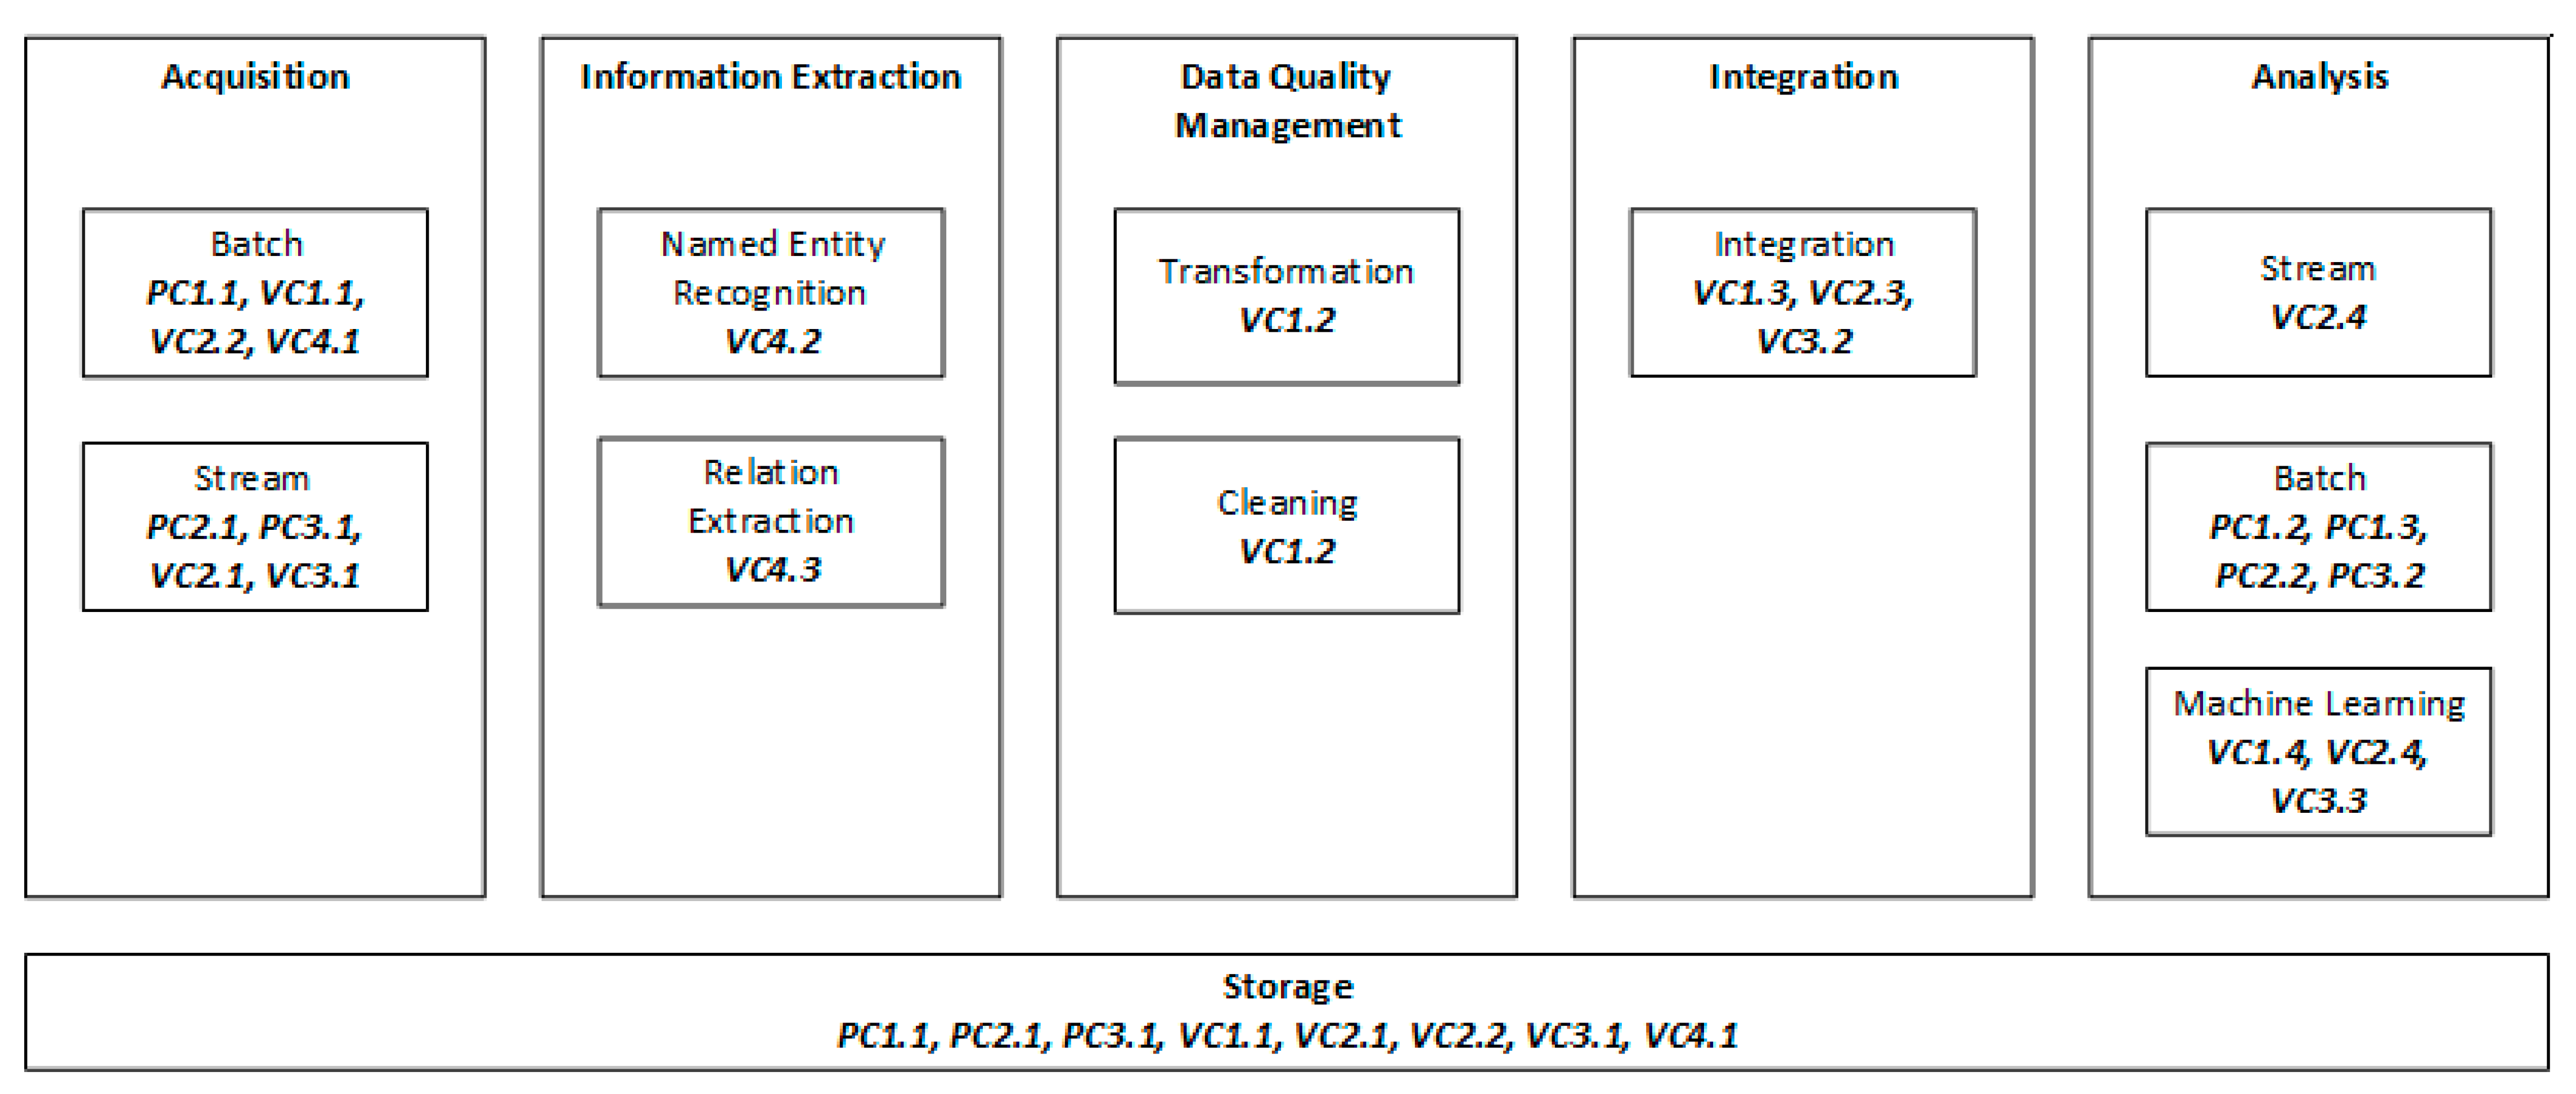
Table 3 shows the functionalities extracted from the three problem cases (PC) and the four validation cases (VC). Figure 6 presents how these functionalities are mapped to the components of the reference architecture proposed in this study.
| |||||||||||||||||||||||||||||||||||||||||||||||||||||||
|
Discussion
References
Notes
This presentation is faithful to the original, with only a few minor changes to presentation, grammar, and punctuation. In some cases important information was missing from the references, and that information was added.
