Difference between revisions of "Journal:Exploration of organic superionic glassy conductors by process and materials informatics with lossless graph database"
Shawndouglas (talk | contribs) (Saving and adding more.) |
Shawndouglas (talk | contribs) (Saving and adding more.) |
||
| Line 51: | Line 51: | ||
==Results== | ==Results== | ||
===Recording daily experiments as graph-shaped data=== | ===Recording daily experiments as graph-shaped data=== | ||
As the essential components of next-generation secondary batteries [12,13,14,16,17,18], solid-state organic lithium-ion conductors were prepared by mixing aromatic polymers, electron-accepting molecules, and lithium salts (Fig. 2a). Several candidates were virtually extracted in our previous [[machine learning]] (ML) study, using the model trained with literature data (>10,000 experimental records). [4] The model indicated a high room-temperature conductivity over 0.1 mS cm<sup>−1</sup>, and we experimentally confirmed some predictions. [4] However, the model could not input process information, even though the properties and hierarchical structures of composite materials are changed drastically by different preparation protocols. [1,7,8] The literature does not provide comprehensive experimental information for each electrolyte, mainly because of the limited space for methodology sections. This is not a problem specific to ionic conductors but has been a general limitation in materials informatics. | |||
[[File:Fig2 Hatakeyama-Sato njpCompMat22 8.png|1000px]] | |||
{{clear}} | |||
{| | |||
| STYLE="vertical-align:top;"| | |||
{| border="0" cellpadding="5" cellspacing="0" width="1000px" | |||
|- | |||
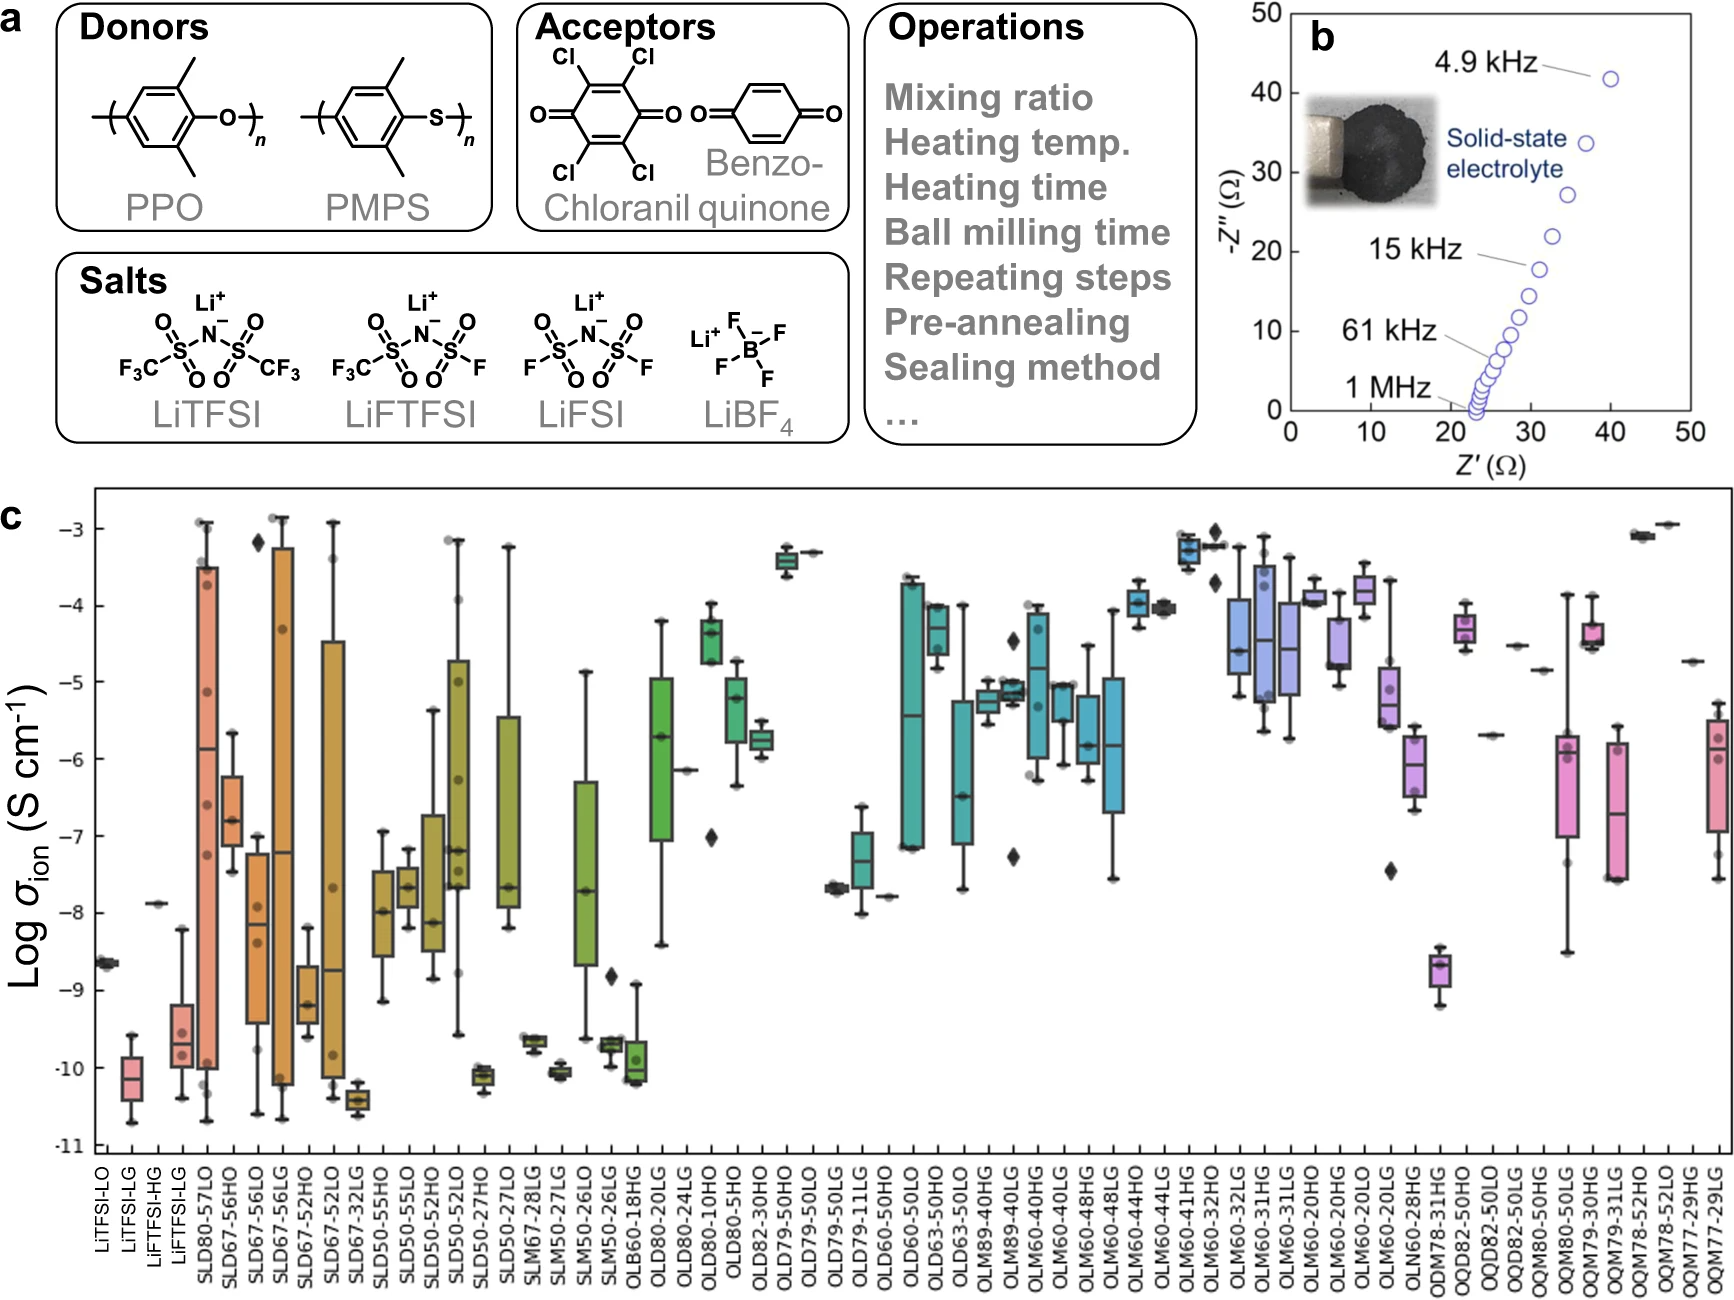
| style="background-color:white; padding-left:10px; padding-right:10px;"| <blockquote>'''Figure 2.''' Electrolyte structures and conductivity. '''a''' Search space of chemical structures and major operations to prepare electrolytes. '''b''' Nyquist plot for a representative electrolyte, PPO/chloranil = 6/4 (mol/mol) with 30 wt % LiFTFSI. Inset: Photograph of the electrolyte layer. '''c''' Experimental ionic room temperature conductivities of the electrolytes. The samples were named using the format ‘XYZMM-NNαβ’, which indicates an electrolyte containing MM mol % donor (X = S: PMPS; O: PPO) versus acceptor (Y = L: chloranil; Q: benzoquinone; D: 2,3-dichloro-5,6-dicyano-''p''-benzoquinone) with NN wt % salt (Z = D: LiTFSI; M: LiFTFSI; N: LiFSI; B: LiBF<sub>4</sub>). Symbols α and β indicate operational conditions (α = H: thermal annealing before measurement; L: room temperature, and β = G: cells were kept in a glove box until measurement; O: kept outside). Box-plot elements are defined as follows. Center line: median, box limits: upper and lower quartiles, whiskers: 1.5x interquartile range, and points: outliers. Supplementary information, Supplementary Discussion g details the effects of the factors for conductivity.</blockquote> | |||
|- | |||
|} | |||
|} | |||
During electrolyte exploration, we used a graph database as an [[electronic laboratory notebook]] (ELN) in which we recorded the daily experiments (Figs. 1, 2b, c). ELNs are commercially available, but they are not specially designed for data science, and are only available in a closed system (i.e., proprietary model). [19] In contrast, our management system uses open-format graphs (XML data) and an open-source processing system (Supplementary Fig. 1). One graph was designed to contain almost all the information for one experiment, including experiment date, environment, experimenter, protocols, chemical formula, and a link to analytical data. | |||
Although the electrolytes were prepared by simply mixing the components, over 40 small steps and at least 100 variable parameters could be recorded for the conductivity measurements (e.g., heating temperature, duration, and timing; Supplementary information, Supplementary Fig. 1). For each experiment, experimental protocols were changed slightly to optimize the conditions. These large numbers of steps are typical to materials science, but recording them using conventional frameworks is unmanageable. The protocols are too complex for standard process informatics tools such as experimental design and Bayesian optimization, which typically focus on less than 10 variables. [1,2,6] Only a representative protocol is usually described in the methodology section of scientific articles. In contrast, no data loss would occur in this system because every experimental result is available as graph data on the public repository. | |||
Revision as of 21:32, 2 November 2022
| Full article title | Exploration of organic superionic glassy conductors by process and materials informatics with lossless graph database |
|---|---|
| Journal | npj Computational Materials |
| Author(s) | Hatakeyama-Sato, Kan; Umeki, Momoka; Adachi, Hiroki; Kuwata, Naoaki; Hasegawa, Gen; Oyaizu, Kenichi |
| Author affiliation(s) | Waseda University, National Institute for Materials Science |
| Primary contact | Email: oyaizu at waseda dot jp |
| Year published | 2022 |
| Volume and issue | 8 |
| Article # | 170 |
| DOI | 10.1038/s41524-022-00853-0 |
| ISSN | 2057-3960 |
| Distribution license | Creative Commons Attribution 4.0 International |
| Website | https://www.nature.com/articles/s41524-022-00853-0 |
| Download | https://www.nature.com/articles/s41524-022-00853-0.pdf (PDF) |
|
|
This article should be considered a work in progress and incomplete. Consider this article incomplete until this notice is removed. |
Abstract
Data-driven material exploration is a ground-breaking research style; however, daily experimental results are difficult to record, analyze, and share. We report a data platform that losslessly describes the relationships of structures, properties, and processes as graphs in electronic laboratory notebooks (ELNs). As a model project, organic superionic glassy conductors were explored by recording over 500 different experiments. Automated data analysis revealed the essential factors for a remarkable room-temperature ionic conductivity of 10−4 to 10−3 S cm−1 and a Li+ transference number of around 0.8. In contrast to previous materials research, everyone can access all the experimental results—including graphs, raw measurement data, and data processing systems—at a public repository. Direct data sharing will improve scientific communication and accelerate integration of material knowledge.
Keywords: materials science, materials informatics, electronic laboratory notebook, data sharing
Introduction
Materials informatics is the study of the data-oriented understanding of materials science data, represented by structures, properties, mechanisms, and protocols. [1] Artificial intelligence (AI) has been used in the field for automated material design, massive data analyses, and accelerated experiments with robots to advance the discovery of materials for energy- and environment-related applications. [1,2,3,4,5]
A long-term challenge in materials informatics and materials science is lossless data sharing by the scientific community. [6] Although materials and devices are sensitive to their preparation processes, materials databases and scientific documents generally do not provide sufficient information. [1,7,8] Most databases focus on structure–property relations and ignore or shorten the preparation protocols. [1,4,6,8] Experimental methods are available in scientific journals, but only specialists can appropriately extract the structure–property–process relationships from the text, and automated text parsing by AI is not yet practical. [7,9] Furthermore, detailed information—including non-representative experimental protocols, lot numbers of reagents, and raw measurement data—is often omitted from articles, which leaves major uncertainties about a material's data. As such, researchers may need to improve their communication style to achieve lossless material data sharing.
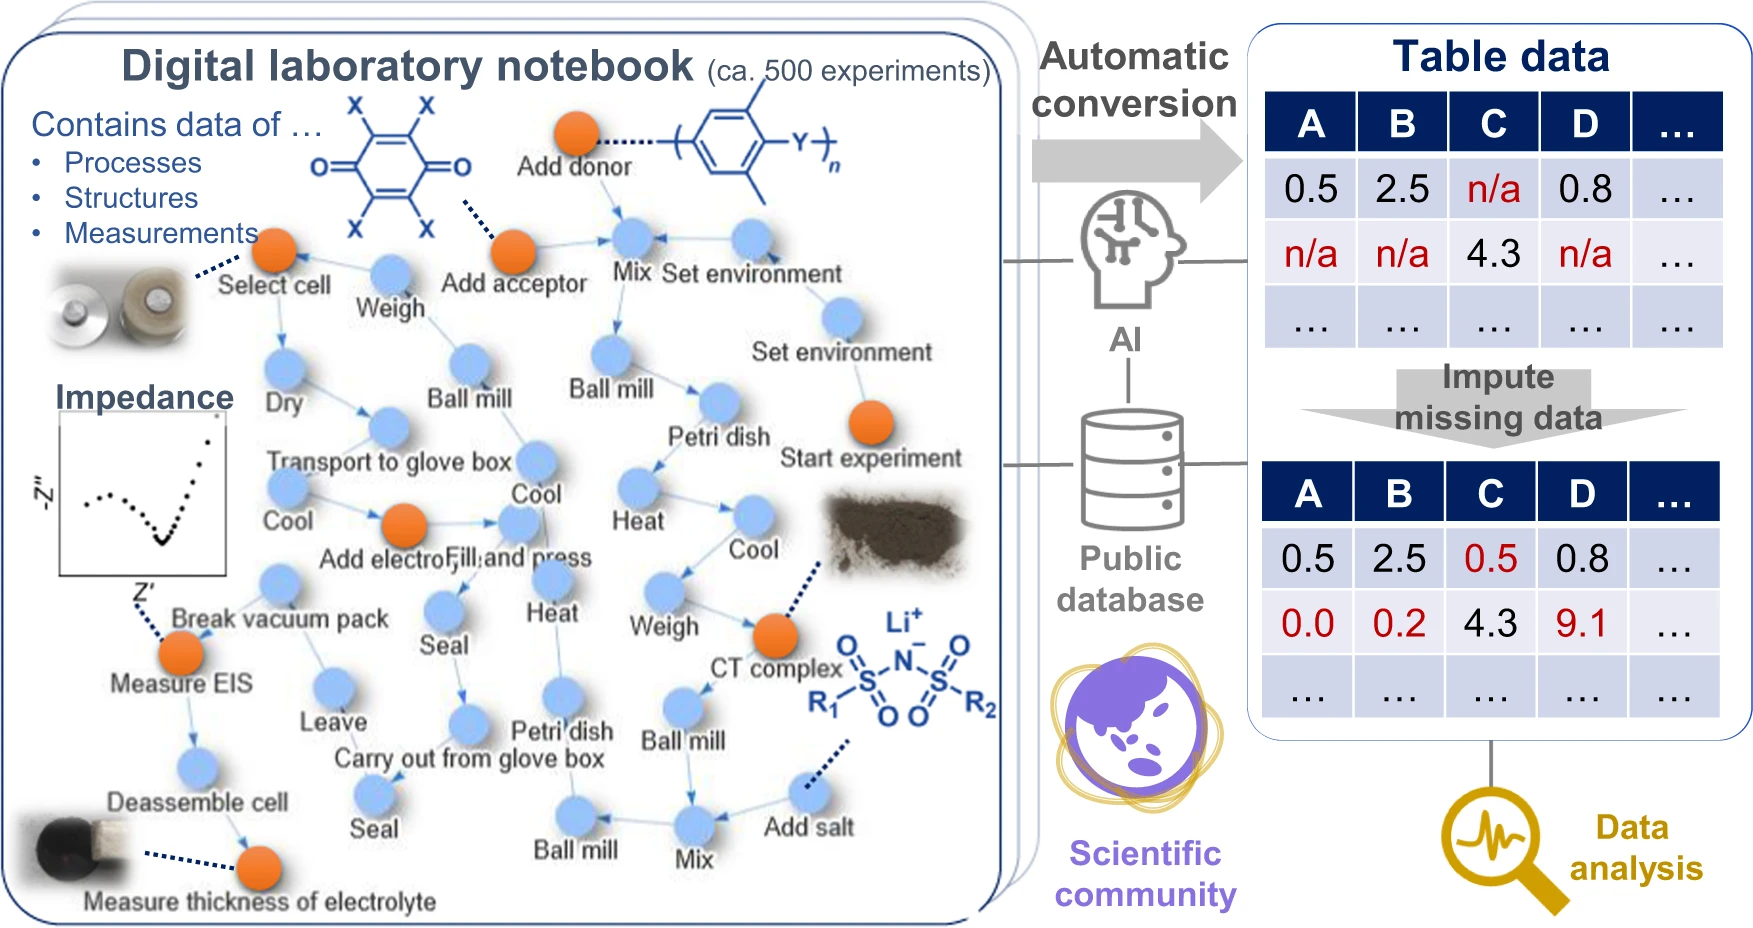
Given these factors, we propose a data platform that can explicitly describe the relations among the structures, properties, and processes of materials (Fig. 1). Based on the concepts of knowledge graphs or flowcharts [7,10], all experimental events are connected as nodes in graphs. Most experimental information can be described losslessly as graphs, the format of which is also compatible with data science. [7] We demonstrated the system by using it in our research of superionic organic conductors, which revealed the factors for achieving a remarkable room-temperature conductivity of 10−4 to 10−3 S/cm and a Li+ transference number of 0.8, practically the highest values of known tested organic solid-state conductors without plasticizers. [11,12,13,14,15] All experimental data, including everyday experimental operations and measurements (over 500 records), were recorded in the database and are available from a public repository. This work is ultimately representative of the demonstration in experimental materials science of the everything-open research style, which should become the standard for scientific communication to accelerate the integration of materials knowledge.
|
Results
Recording daily experiments as graph-shaped data
As the essential components of next-generation secondary batteries [12,13,14,16,17,18], solid-state organic lithium-ion conductors were prepared by mixing aromatic polymers, electron-accepting molecules, and lithium salts (Fig. 2a). Several candidates were virtually extracted in our previous machine learning (ML) study, using the model trained with literature data (>10,000 experimental records). [4] The model indicated a high room-temperature conductivity over 0.1 mS cm−1, and we experimentally confirmed some predictions. [4] However, the model could not input process information, even though the properties and hierarchical structures of composite materials are changed drastically by different preparation protocols. [1,7,8] The literature does not provide comprehensive experimental information for each electrolyte, mainly because of the limited space for methodology sections. This is not a problem specific to ionic conductors but has been a general limitation in materials informatics.
|
During electrolyte exploration, we used a graph database as an electronic laboratory notebook (ELN) in which we recorded the daily experiments (Figs. 1, 2b, c). ELNs are commercially available, but they are not specially designed for data science, and are only available in a closed system (i.e., proprietary model). [19] In contrast, our management system uses open-format graphs (XML data) and an open-source processing system (Supplementary Fig. 1). One graph was designed to contain almost all the information for one experiment, including experiment date, environment, experimenter, protocols, chemical formula, and a link to analytical data.
Although the electrolytes were prepared by simply mixing the components, over 40 small steps and at least 100 variable parameters could be recorded for the conductivity measurements (e.g., heating temperature, duration, and timing; Supplementary information, Supplementary Fig. 1). For each experiment, experimental protocols were changed slightly to optimize the conditions. These large numbers of steps are typical to materials science, but recording them using conventional frameworks is unmanageable. The protocols are too complex for standard process informatics tools such as experimental design and Bayesian optimization, which typically focus on less than 10 variables. [1,2,6] Only a representative protocol is usually described in the methodology section of scientific articles. In contrast, no data loss would occur in this system because every experimental result is available as graph data on the public repository.
References
Notes
This presentation is faithful to the original, with only a few minor changes to presentation. In some cases important information was missing from the references, and that information was added.


