Difference between revisions of "User:Shawndouglas/sandbox/sublevel12"
Shawndouglas (talk | contribs) Tag: Reverted |
Shawndouglas (talk | contribs) Tag: Reverted |
||
| Line 232: | Line 232: | ||
The sequence of computer-based product development in scientific applications isn’t an accident. Vendors began with what they knew—instruments—and built products to improve their use. In informatics, LIMS came first, because service lab environments were well characterized and understood by the vendors. In sample preparation and the application of robotics to lab work, microplate support systems have seen wide and rapid development, while general-purpose applications are well behind that development curve. The development of ELNs has been less aggressive than LIMS, because of the variability of the underlying processes. If you want products developed, give the vendors a well-characterized, widely applicable process with enough potential sales opportunities to justify the work. | The sequence of computer-based product development in scientific applications isn’t an accident. Vendors began with what they knew—instruments—and built products to improve their use. In informatics, LIMS came first, because service lab environments were well characterized and understood by the vendors. In sample preparation and the application of robotics to lab work, microplate support systems have seen wide and rapid development, while general-purpose applications are well behind that development curve. The development of ELNs has been less aggressive than LIMS, because of the variability of the underlying processes. If you want products developed, give the vendors a well-characterized, widely applicable process with enough potential sales opportunities to justify the work. | ||
===Instrument data capture=== | |||
This was the subject of the Lab Bench chapter, and for the most part we’ll leave it at that. The only point we will make is that as instrument data systems (in some cases, most notably chromatography) took on the ability to support multiple instruments with a single computer, those systems took on rudimentary sample tracking capability. It wasn’t at the level of a commercial LIMS, but it was sufficient to manage multiple samples with multiple users and their worklists. | |||
There is one point that we need to make that will apply to all the material in this book: questions that will be in the back of your mind are “How does that relate to my lab needs?” or “How can we make use of that?” Before you consider questions like that, you have to know how you want your lab to operate/function and what your requirements are. In order for you to be successful in applying products to lab work, you have to understand what problems you want to solve and how a given product's capabilities relate to them. There is always the possibility that some technology will come along and change the way you look at lab work. In order to appreciate that possibility, you have to understand your overall plan for technology usage. | |||
===Sample tracking=== | |||
In the 1960s, instrument vendors and a few lab people were experimenting with interfacing computers and instruments. These systems were noted as “data stations.” In the 1970s, Perkin-Elmer Corporation began the development of a computer system to address laboratory management problems and created the first commercial LIMS. The intent of the name was to put some distance between it and the data stations it was selling and give the impression of covering all of a lab's needs. To put things into some temporal perspective, the ELN, a text-processing-heavy application, was in the future; word processors were just coming on the market. LIMS was a poor choice for a product name since users expected it to cover all “laboratory information,” including budgets, vacation schedules, documents, and any information they might have in the lab. What it did do is help track samples. | |||
Within quality control and analytical laboratories, managing sample flow was a significant problem consuming people's time, and addressing it was a worthwhile effort (Perkin-Elmer’s – ‘P-E’ - instruments were used in chemical analysis and as a result, these labs were natural marketing targets). (The problem was described in the service lab section above and the workflow view shown in Figure 3-8.) The P-E product was the first of a long list of products to address the same issue, some with overlays to handle specific markets. One list<ref name="LWLIMSVendor">{{cite web |url=http://www.limswiki.org/index.php/LIMS_vendor |archiveurl=https://web.archive.org/web/20150226154945/https://www.limswiki.org/index.php/LIMS_vendor |title=LIMS vendor |work=LIMSwiki.org |date=04 February 2015 |archivedate=26 February 2015 |accessdate=05 April 2024}}</ref> contains over one hundred products. Among the specific markets are the: | |||
* wine industry, with its unique tests; | |||
* food and beverage industry, with its product stability testing; and the | |||
* pharmaceutical and biotech industries, with its formulation work (similar to stability work) concerned with environmental issues and the effectiveness of formulation over time and with different packaging/delivery systems. | |||
Tailoring LIMS to address these activities can significantly reduce the amount of effort needed to manage testing and drastically reduce the amount of data entry required. One common application is product stability testing, as noted above. | |||
A project is created where a series of samples are placed in controlled environments (i.e., temperature, humidity, etc.) and tested according to a schedule that can run to hundreds of sample-test combinations; a stability overlay asks some basic questions and then generates the test regime and logins needed to support the work. Without this type of application overlay, each sample would have to be logged in individually, opening the possibility of data entry errors and requiring someone to check each entry and correct mistakes, a time-consuming, labor-intensive process. | |||
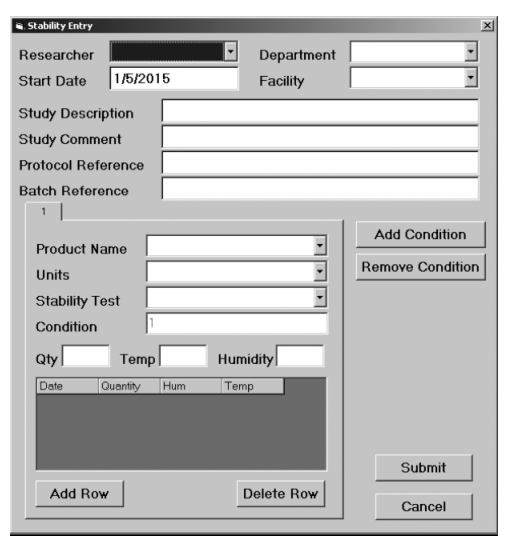
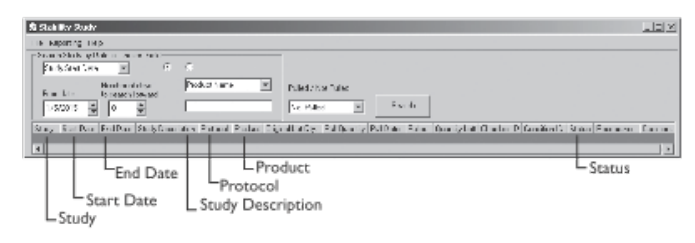
The following illustrations and descriptive text, provided and used with permission by LabLite Systems LLC, show a data entry screen (Figure 3-9a) and a search screen (Figure 3-9b). | |||
[[File:Fig3-9a Liscouski LabInfo24.png|500px]] | |||
{{clear}} | |||
{| | |||
| style="vertical-align:top;" | | |||
{| border="0" cellpadding="5" cellspacing="0" width="500px" | |||
|- | |||
| style="background-color:white; padding-left:10px; padding-right:10px;" |<blockquote>'''Figure 3-9a.''' Stability Data Entry Screen. The Stability Entry screen allows your organization to standardize the way studies are created and submitted. Each of the dropdown fields on this screen pull data from tables that are pre-populated by LabLite or an administrator. Each study can have any number of pre-defined conditions. When researchers enter their study information into the program the pulls [tests] for each study condition populate based on predefined rules. The researcher can also go into the grid for each condition and open the calendar tool to schedule additional pulls.</blockquote> | |||
|- | |||
|} | |||
|} | |||
[[File:Fig3-9b Liscouski LabInfo24.png|600px]] | |||
{{clear}} | |||
{| | |||
| style="vertical-align:top;" | | |||
{| border="0" cellpadding="5" cellspacing="0" width="600px" | |||
|- | |||
| style="background-color:white; padding-left:10px; padding-right:10px;" |<blockquote>'''Figure 3-9b.''' Stability Study Screen. After logging into the stability program users are brought to a search screen. From this screen you can use the dropdowns to search for study information in a variety of ways; including study start, end or pull [test] date; product name or number, study number, lot number, researcher, department, reference number, etc. You can also choose to show all items or only those that have been pulled or not pulled.</blockquote> | |||
|- | |||
|} | |||
|} | |||
Another is the clinical industry. One point that needs to be addressed is the difference between a LIMS and LIS. They are very similar systems in terms of function and capability. LIMS is used in a much broader market (e.g., life sciences, environmental, chemical, oil and gas, etc.), almost everywhere except clinical environments. LIS are rarely encountered outside clinical labs because of their close ties to patient records and healthcare. Some LIMS vendors will try to sell their products into clinical labs claiming that their offerings are technically more sophisticated and using current technologies. That said, there are two basic but significant differences: | |||
# LIS is patient-centered. It is still sample tracking (with test results), but everything is tied to the patient, providing a higher level of organization. This allows a doctor to examine a patient’s records over time and by test. A LIMS is sample-oriented; samples may be part of a project (the project name would be part of the sample description) or a stability (or similar) test program. This difference is significant because of laws controlling access to patient health records and the need to coordinate a patient’s clinical results with other health and personal data. This brings us to the second difference. | |||
# LIS supports [[Health Level 7]] (HL7) communications. We’ll cover the details in the Standards Appendix, but the short version is this: clinical LIS has to communicate with systems both within the lab and outside of it. HL7 provides the mechanism to do that, and that isn’t supported (broadly) by LIMS. It allows LIS to "talk" to [[hospital]] administrative systems and instrument data systems, providing a foundational element to “total laboratory computing” systems. It helps things work together in ways that haven’t yet happened in the broader life sciences and industrial markets. This is a very large point and has contributed to cost reductions in laboratory testing. | |||
The following list is a set of functions that you should expect a LIMS to support, the information is from the ''Laboratory, Scientific, and Health Informatics Buyer's Guide''<ref name="LWLabSciHealth15">{{cite web |url=http://www.limswiki.org/index.php?title=Laboratory,_Scientific,_and_Health_Informatics_Buyer%27s_Guide |archiveurl=https://web.archive.org/web/20150214043219/http://www.limswiki.org/index.php?title=Laboratory,_Scientific,_and_Health_Informatics_Buyer%27s_Guide |title=Laboratory, Scientific, and Health Informatics Buyer's Guide |work=LIMSwiki |date=02 February 2015 |archivedate=14 February 2015 |accessdate=05 April 2024}}</ref>: | |||
* audit trail | |||
* barcoding | |||
* batching | |||
* chain of custody | |||
* configurable setup | |||
* customization capabilities | |||
* data entry | |||
* data warehousing and mining | |||
* document management | |||
* electronic data exchange | |||
* event-driven actions | |||
* fax and email integration | |||
* formulas | |||
* instrument interfacing, calibration, and maintenance | |||
* inventory | |||
* login and accessioning | |||
* multiple location/department support | |||
* pairing external files to LIMS samples | |||
* regulatory compliance | |||
* reporting | |||
* review and approval | |||
* sample management and tracking | |||
* scheduling | |||
* training tracking | |||
* trending and control charting | |||
* version control | |||
* workload management | |||
* workflow management | |||
A more extensive set of functions can be found in the ASTM E1578-13 standard, including those that extend beyond LIMS and LIS.<ref name="ASTME1578-13" /> Both LIMS and LIS have functions that support the model in Figure 3-8. That said, there are a few additional points worth noting. | |||
Systems provide functions for sample logins that include: | |||
* Manual logins – reading information from forms and entering it into the system; the gains in productivity come from the ease of working with the information once it is entered. Logins also support the printing of [[barcode]]d labels with sample IDs and information you feel is relevant. | |||
* Batch logins – being able to log in several samples with similar requirements as a group, each with its sample ID. Reduces information entry and speeds the process along. | |||
* Remote logins – allowing submitters to log samples in. | |||
* Scheduled logins - occuring automatically at a given frequency, producing a sample label at the remote sampling location. | |||
Event-driven actions can be tied to the login process as well as other events. For example, if samples haven’t arrived in the lab, an “event-driven action” can notify lab personnel when the samples arrive, and their status changes from “waiting” to “in the lab.” | |||
Revision as of 19:01, 5 April 2024
|
|
This is sublevel12 of my sandbox, where I play with features and test MediaWiki code. If you wish to leave a comment for me, please see my discussion page instead. |
Sandbox begins below
Title: Laboratory Informatics: Information and Workflows
Author for citation: Joe Liscouski
License for content: Creative Commons Attribution-ShareAlike 4.0 International
Publication date: April 2024
NOTE: This content originally appeared in Liscouski's Computerized Systems in the Modern Laboratory: A Practical Guide as Chapter 3 - Laboratory Informatics / Departmental Systems, published in 2015 by PDA/DHI, ISBN 193372286X. This is reproduced here with the author's / copyright holder's permission. Some changes have been made to the original material, replacing some out-of-date screen shots with vendor-neutral mock-ups, for example. In addition, note that some specifications for network speeds are out-of-date but the concerns with system performance are still realistic.
Introduction
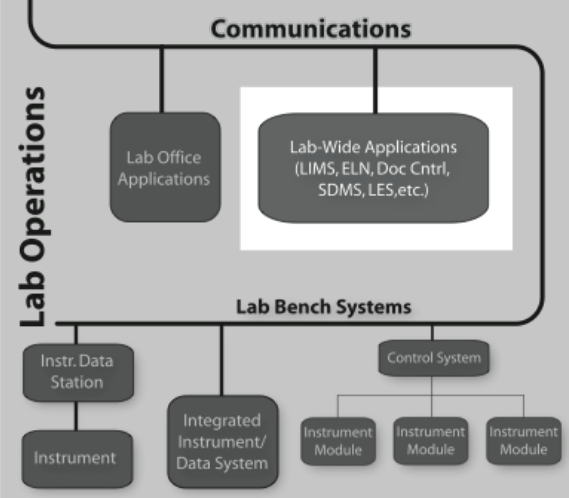
Laboratory informatics refers to software systems that usually are accessible at the departmental level–they are often shared between users in the lab-and focus on managing lab operations, and lab-wide information rather than instrument management or sample preparation (Figure 3-1).
|
Differing from standard office applications (e.g., word processing, spreadsheets, etc.), laboratory informatics software solutions include the:
- laboratory information management system (LIMS) and laboratory information system (LIS)
- electronic laboratory notebook (ELN)
- document management system (DMS)
- scientific data management system (SDMS)
- laboratory execution system (LES), and
- chemical inventory management (CIM).
Before we get into the details of what these technologies are, we must establish a framework for understanding laboratory operations so that we can see where products fit in the lab's workflow. The products you introduce into your lab are going to depend on the lab's needs, and given the complexity of vendor offerings and their potential interactions and overlapping capabilities, defining your requirements is going to take some thought.
These products are undergoing a rapid evolution driven by market pressures as vendors compete for your business, partly by trying to cover as much of a lab’s operations as they can. If you look at functional checkboxes in brochures, they often cover similar elements, but their strengths, weaknesses, and methods of operation are different, and those differences should be important to you.
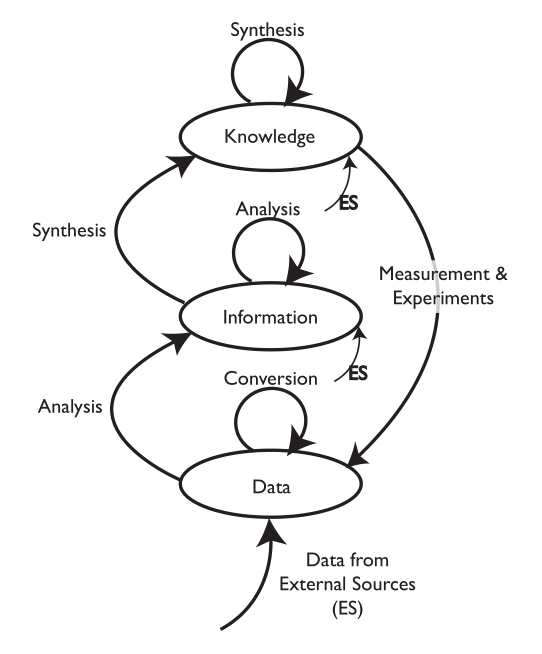
We are going to start by comparing two different types of laboratory environments: research labs and service labs (laboratories whose role is to provide testing, and assays, for example, quality control, clinical labs, etc.). That comparison and subsequent material is going to be done with the aid of an initially simple model for the development and flow of knowledge, information, and data within laboratories (Figure 3-2).
|
The model consists of ovals and arrows; the ovals represent collections of files and databases supporting applications, and the arrows are processes for working with the materials in those collections. The “ES” abbreviation notes processes that bring in elements from sources outside the lab. The first point we need to address is the definition of “knowledge,” “information,” and “data,” as used here. We are not talking about philosophical points, but how these are represented and used in the digital world. “Knowledge” is usually reports, documents, etc. that may exist as individual files or be organized and accessed through applications software. That software would include DMSs, databases for working with hazardous materials, reference databases, and access to published material stored locally or accessed over internal/external networks.
“Information” consists of elements that can be understood by themselves such as pH measurements, the results of an analysis, an object's temperature, an infrared spectrum, the name of a file, and so on. Information elements can reside as fields in databases and files. Information can be provided as meaningful answers to questions. Finally, “Data” refers to measurements that by themselves may not have any meaning, or that require conversion or be combined with other data and analyzed before they are useful information. For example, the twenty-seventh value in a digital chromatogram data stream, the area of a peak (needs comparison to known quantities before it is useful), millivolt readings from a pH meter (you need temperature information and other elements before you can convert it to pH), etc.
There are grey areas and examples where these definitions may not hold up well, but the key point is how they are obtained, stored, and used. You may want to modify the definitions to suit your work, but the comments above are how they are used here.
The arrows represent processes that operate on material in one storage structure and put the results of the work in another. Processes will consist of one or more steps or stages and can include work done in the lab as well as outside the lab (outsourced processing, access to networked systems, for example). It is possible that operations will be performed on material in one storage structure and have those results placed in the same storage level. For example, several “information” elements may be processed to create a new information entity.
Initially, we are going to discuss the model as a two-dimensional structure, but those storage systems and processes have layers of software, hardware, and networked communications. In addition, the diagram as shown is a simplification of reality since it shows only one process for an experiment. In the real world, there would be a process line for each laboratory process in your lab, and the “data” oval would represent a collection of data storage elements from each of the data acquisition/storage/analysis systems in the lab. Each experimental process would have a link to the “knowledge” structures catalog of standard operating procedures (SOPs). As we start to build on this structure we can see how requirements for products and workflow can be derived.
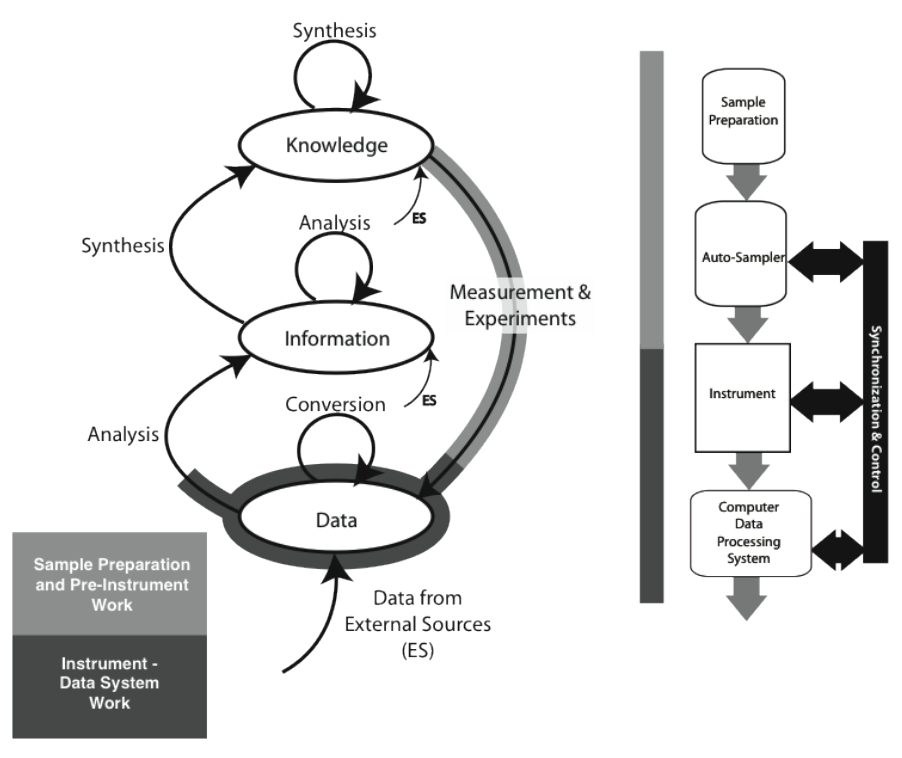
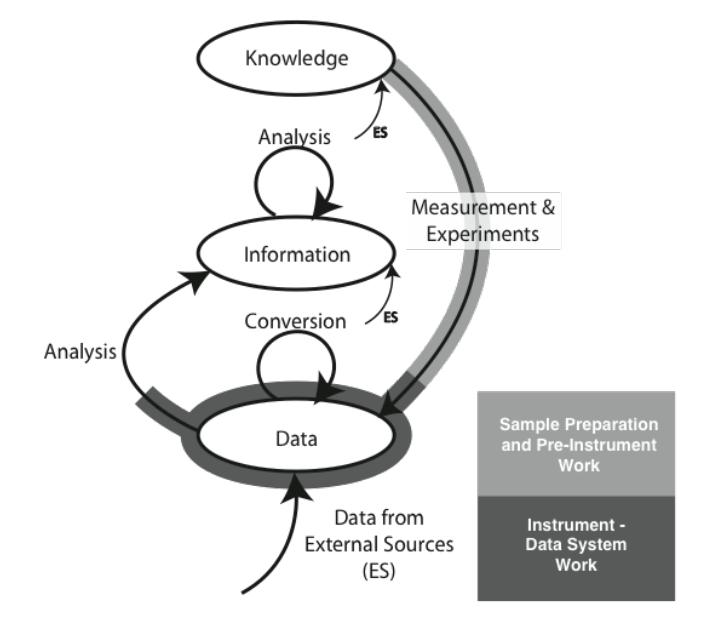
The material covered in the Lab Bench chapter (Chapter 1) fits the model as shown in Figure 3-3 (the model used in the Lab Bench discussion is shown as well; it is represented by the light-/heavy-grey lines in the K/I/D model). The sample preparation and pre-instrumental analysis work is shown as the light-grey / heavy-line portion of the “Measurement & Experiments” process, with instrumental data acquisition, storage, and analysis displayed with the darker grey/heavy line (which may be entirely or partly completed by the software; the illustration shows the “partial” case). Not all experiment/instrument interactions result in the use of a storage system. Balances, for example, may hold one reading and then send it through to the information storage on command, where it may be analyzed with other information. The procedure description needed to execute a laboratory process—the measurement and experiment—would come from material in the “Knowledge” storage structure.
|
What we are concerned about in laboratory informatics is what happens to the data and information that results either from data analysis or information gained directly from experiments.
Comparing two different laboratory operational environments
By its nature, research work can be varied. SOPs may change weekly or more slowly, and the information collected can change from one experiment to another. The information collected can be in the form of tables, discrete reading, images, text, video, audio, or other types of information. The work may change depending on the course of the research project. Aside from product support on the lab bench, the primary need is for a means of recording the progress of projects and managing the documents connected with the work.
Until recently, that need was met through the use of paper notebooks, with entries dated, signed by the author, and counter-signed by a witness. The researcher would document the work by handwritten entries, and instrument output would be recorded similarly or have printouts taped to notebook pages. Anything that could not be printed and pasted in would have references entered. There are a few problems with this approach:
- Handwritten records can be difficult to decipher.
- Paper is subject to deterioration by a variety of methods.
- Taped/pasted entries can come loose and be lost.
- References to files, tapes, instrument recordings, etc. that are stored separately can become difficult to track if the material is moved.
- “Backup” can be a problem since you are working with physical media; the obvious step is to make copies of every page after it has been signed and witnessed.
- The notebook contents, particularly if the notebook has been archived, are only useful for as long as someone remembers that they exist and can provide information that helps in locating the entries. Most labs have stories that start “I remember someone doing that work, but…” and the matter is either dropped or the work repeated.
The intellectual property recorded in notebooks is of value only if someone knows it exists, and that it can be found and understood. There is another point that needs to be mentioned here that we will reference later: lab personnel consider entries in paper lab notebooks as “their work and their information.” To the extent that it represents their efforts, they are right, but when it comes to access control and ownership, the contents belong to whoever paid for the work.
Research work is sometimes done by a single individual, but often it has several people working together in the same lab or collaborating with researchers in other facilities. Those cooperative programs may be based on:
- Researchers working on independent projects from a common database of information on biological materials, chemical compounds and their effect on bacteria or viruses, toxicology, pharmacology, pharmacokinetics, reaction mechanisms, etc. in life sciences, data gathered from particle collisions in physics, chemical structures in chemistry, and so on.
- Researchers working in collaborative programs where the outcomes are co- authored reports, presentations, etc.
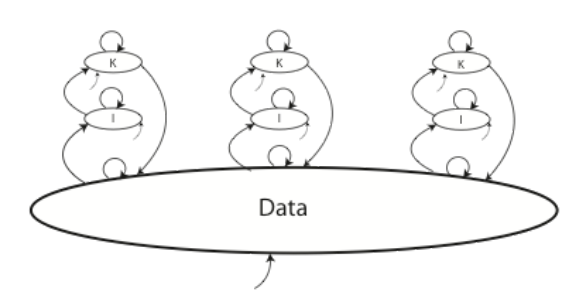
Whether we are looking at single individuals or cooperative work, each of those situations has an impact on the way knowledge, information, and data is collected, developed, shared, and used. For example, take a look at Figure 3-4 below.
|
The figure shows three researchers working on individual projects, contributing to, and working from, a common data set; this could in fact be one data system or a collection of data systems from different sources. The bottom arrow represents data coming in from some outside source.
Regardless of whether this is an electronic system or a paper-based process, there still is the following set of requirements:
- There has to be a catalog of what records are in the system, as people need the ability to read the catalog, search it, and add new material. Removing material from the catalog would be prohibited for two reasons. First, someone might be using the material and deletion would create problems. Second, if you are working in a regulated environment, deleting material is not permitted. Making this work means that someone is going to be tasked as the system administrator.
- Material cannot be edited or modified. If changes are needed, the original material remains as-is, and a new record with the changed material is created that would contain a description of the changes, why they were made, who is responsible, and when the work was done (i.e., via an audit trail). This creates a parent-child relationship between data elements that could become a lengthy chain. One simple example can be found with imaging. An image of something is taken and stored, and any enhancements or modifications would create a set of new records linked back to the original material. This is an audit trail with all the requirements that are carried with it.
- The format for files containing material should be standardized. Having similar types of material in differing file structures can significantly increase the effort and ability to work with the data (data in this case, with the same issues extending to information and knowledge). If you have two or more people working with similar instruments, having the data stored in the same format is preferable to having different formats from different vendors. Plate readers (for microplates) usually use CSV file formats; however, instruments such as chromatographs, spectrometers, etc. will use different file formats depending on the vendors. If this is the case, you may have to export material in a neutral format for shared access. At this point in time, the user community has not developed the standardized file format for instrumentation to make this possible, hence the use of “should” earlier in this bullet rather than a stronger statement. That could change with the finalization of the ANiML standard for analytical data.[1] Users can standardize the format within their organization by working within a vendor’s product family.
- The infrastructure for data backups should be instituted to protect the material and access to it. This point alone would shift the implementation toward electronic data management because of the ease with which this can be done. Data collection represents a significant investment in resources, with a corresponding value, and backup copies (local and remote) are just part of good planning.
- Policies have to be defined about when and how archiving takes place. Material may be old, but still referenced, and removing it from the system will create issues. If the implementation is electronic, storage systems are becoming inexpensive, so expanding storage should not be a problem.
- The system must have sufficient security mechanisms to protect from unauthorized access and electronic intrusion.
These points form a basic set of requirements, that will be expanded, for any shared knowledge/information/data repository. If we extend the model to having the three individuals combine their “knowledge” sets into one shared repository, the same issues apply; they may be collaborating on a research project. The standardization of file formats is simpler since most “knowledge” is recorded as text and the processes for working that kind of material have been addressed, at least well enough to be readily workable with existing tools.
Service laboratories—those that do work supporting other departments, labs, etc. such as quality control, clinical chemistry, and so on—have a different set of operational characteristics. The model for service labs is very similar to that of research with one distinction: the “Synthesis” process is absent (Figure 3-5). That process is the one used to develop new knowledge. In the case of service labs, that knowledge is represented by test or assay procedures. Those procedures normally come from other sources and are not usually developed by service labs. One departure from this view is contract testing labs which may, as part of their contract, be tasked with procedure development. Analytical research groups are another, but while they may have some service lab work, they are also doing non-routine work that includes method development, and function as a specialized research-service laboratory.
|
From the test submitter's point-of-view, they request test/assay work and wait patiently for the results from service labs. Those requests may be sporadic depending on the environment the lab operates in, or regularly scheduled as they would support a production process, with requests going to quality control.
The perspective from inside the lab is a bit different. Test requests arrive that may or may not be accompanied by the material to be tested. In both cases, the samples are logged in, prioritized, and scheduled for work. If the samples are not there, they are either collected (may be part of the lab's work) or put on hold until the samples arrive, then they are added to the work queue. As part of the lab operations, there is a need to:
- Generate worklists for different tests that will include the priority of work, sample locations, and who is scheduled to carry out the analysis; analysts may be required to obtain the samples or submit requests to a (physical) sample management system.
- Support queries for sample status, i.e., the “where are my results” requests.
- Provide a means of entering test results.
- Track sample status through phases of work; some results may be completed faster than others, priorities may change after some testing is done, additional testing may be required, and some test processes may require several different tests to be performed, which is common in clinical work, product stability testing, and formulation work.
- Review results, which can cause some tests to be repeated; if results are approved, reports need to be issued.
- Maintain instrument calibrations.
- Ensure that lab personnel have their training up-to-date.
- Ensure that reagents are up-to-date and have their quality/assays reviewed/checked.
- Prepare samples and carry out testing programs, which could include testing on a series of samples, or a scheduled program of testing of one or more materials (e.g., stability testing, formulations, etc.).
Aside from the use of scientific instruments, much of this behavior may seem to be typical of a variety of service-oriented operations. That point will be addressed later. The nature of service lab operations is highly structured and routine. You could move from one service to another, regardless of industry, and aside from the details of testing, feel comfortable with the routine.
The most time-consuming part of service lab operations is managing the workflow and keeping track of incoming and outgoing test requests and samples. It is bookkeeping work. Without the aid of computer systems, it is a matter of manually logging samples in—transcribing information from request forms into log books, using the same log books to find out what work needs to be done, and so on. Most of the management effort revolves around the logbook, including logging samples out, so time is wasted waiting for access to that book.
There is another characteristic service labs have that is not always shared with research environments: the need to communicate with other groups. Service labs don’t exist as independent facilities, and they have to be able to send and receive documents from other groups. In a research organization, it is the research lab themselves, while in production environments it is raw material receipt (i.e., certificate of analysis approval and testing), process control (i.e., in-line testing, product quality), shipping (i.e., certificates of analysis, product release documents), and customer service (i.e., product lot specifications).
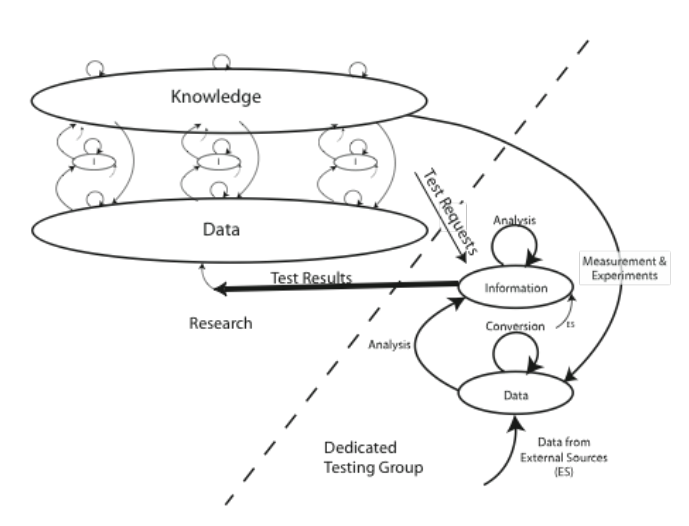
Not all lab situations are as cleanly divided as described although many are. In small research operations, you may find both sets of characteristics in one operation, all under the heading of “research.” The laboratory workflow model for that situation is shown in Figure 3-6.
|
The illustration shows a research group on the left with a common “data” resource, and storing the results of their work in a common “knowledge” structure (common in collaborative work) that can consist of reports, SOPs, materials catalogs, and so on. Each researcher works on their experiments and the dedicated testing group provides characterization / analytical services where needed (the testing group would get its SOPs from the research knowledge base, it may also develop its own).
One thing that is important to note is that the words “information” and “data” appear on both sides of the diagram. A sample may be submitted to the testing group to determine its purity. Using instrumental techniques, UV spectrophotometry or chromatography for example, results in the testing groups “data,” which is then analyzed to give a purity value which is recorded as “information.” When the results are transmitted back to research, they may reclassify the status of the value to “data” due to the nature of the experiments being done.
The point here is to contrast different operating characteristics of labs so that we can later show how informatics products fit differing laboratory workflows. In reality, multiple informatics products may be used by both types of labs, some with a stronger emphasis on one over another depending on the features the products have and how they help you work. Some are better suited to the inherent flexibility required in research, others fit the laboratory management requirements of the service lab, and still others will find useful applications in both. It is a matter of understanding what your needs are now and where they might go in the future. The next section will look at product capabilities and use so that you can match your needs to potential solutions, and be able to evaluate characteristics that can impact their implementation.
Informatics and laboratory functions
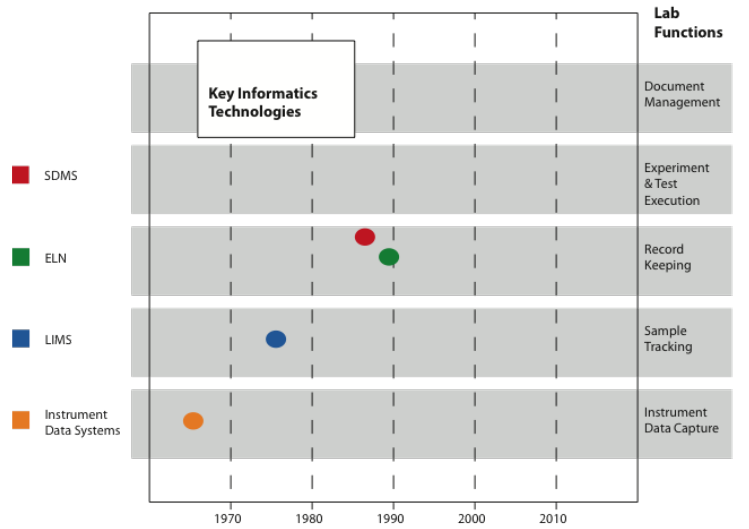
Figure 3-7 shows a set of five laboratory functions and four key informatics technologies, with the approximate dates that they came on the market. Since we are looking at technologies from multiple vendors with variations in functionality, the dates are guides. Over time, the technologies noted have evolved due to requests from customers and market pressures to remain competitive in the marketplace. Along the way vendors have closed shop, kept their place in the market, and also merged with other companies with products merged, retired, or remained active.
|
One thing you’ll notice is that there are no product technologies in Figure 3-7 for “Document Management” and “Experiment & Test Execution.” Document management had been considered as a text document management issue and addressed by commercial software used for that application, the same type of software used in other departments. The initial product for experiment and test execution began with Velquest’s SmartLab (Velquest is now part of BIOVIA as of 2014), which was offered in the early 2000’s as a laboratory notebook: “VelQuest's electronic Laboratory Notebook using the SmartLab (electronic Process Management & Compliance) software, with a primary focus on the Procedure Execution module including data review and data reporting.”[2] As the ELN market developed, the product was recast as a LES, first by Velquest, then by Accelrys.[3]
As you will see, the market has been undergoing rapid changes since the 1960s. Those changes have been due to:
- Computer hardware and software technology changes, which have seen computing moved from the data center to the lab desk and bench, and commercial software becoming available with increasing capability and ease-of-use.
- The market acceptance of computing and a shift in control of computing from management information systems (MIS, the precursor to today’s IT group) to individual groups with IT oversight.
- Laboratory professionals' acceptance of the role of computers in the lab, followed by developing needs for systems with more capability. To be fair, much of this was driven by vendors who saw opportunities, created products to meet needs, and educated those working in the lab about what they could accomplish using the products. The lab-professional-as-a-computing- technology-driver has yet to be realized; this is a needed development to help vendors understand what capabilities people want and give them a better footing to build their product development programs.
We’ll discuss the technologies in the order they came onto the market, which will help you understand how these products developed over time. Their appearance was spurred by people's experience with the earlier products, and vendors worked to fill gaps in offerings by upgrading existing products or creating new ones. One point we will address now, from the user's perspective, is the difference between the ELN and the LIMS.
In the case of an ELN, information is largely organized by experiment or research project/program. The content of an ELN is varied depending on the nature of the work being done, but it is typically heavily text-oriented. ELNs are widely applicable to most lab environments, with specialized variants for biology, chemistry, etc. ELNs are primarily a tool for recording descriptions, measurements, results, plans, experiments, and research projects. They can be viewed as a shareable (if desired) electronic diary.
With a LIMS, information is organized by sample (or samples within a test series such as stability or formulations work). The contents are usually numerical values but may also contain brief text entries. The use of LIMS is normally limited to organizations that provide testing services in a wide range of industries and are heavily used in quality control. LIMS is primarily a workflow/workload management tool with the ability to record the results of testing on samples. The LIS is a variation of LIMS targeted for the clinical and healthcare markets.
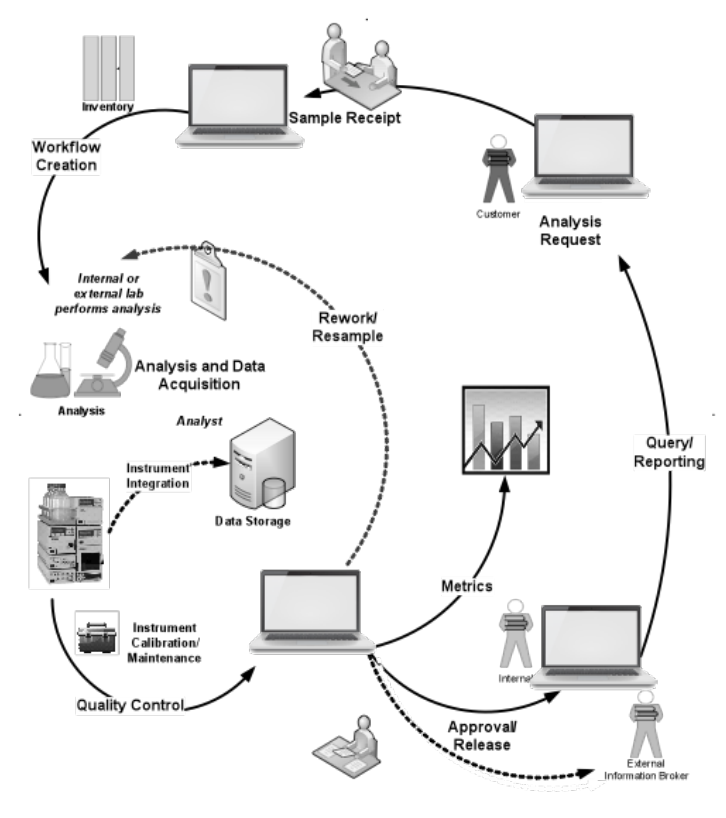
You’ll also note that descriptions for research work (such as the one above) are less detailed than those for service labs. Research work is very flexible, and the structure behind the work depends on the industry and how the lead researcher chooses to go about organizing programs and projects. Service labs have a consistent structure and behavior between industries and the type of work being done (clinical, analytical, physical testing, etc.) and as a result, are easier to describe. Figure 3-8 can be applied to almost any service lab in any industry. Trying to come up with a similar diagram for research with the same level of generalization would be difficult. This has an impact on vendors and the products they develop: the better characterized a process is, and the wider the application, the more likely they are to invest in product development.
|
The sequence of computer-based product development in scientific applications isn’t an accident. Vendors began with what they knew—instruments—and built products to improve their use. In informatics, LIMS came first, because service lab environments were well characterized and understood by the vendors. In sample preparation and the application of robotics to lab work, microplate support systems have seen wide and rapid development, while general-purpose applications are well behind that development curve. The development of ELNs has been less aggressive than LIMS, because of the variability of the underlying processes. If you want products developed, give the vendors a well-characterized, widely applicable process with enough potential sales opportunities to justify the work.
Instrument data capture
This was the subject of the Lab Bench chapter, and for the most part we’ll leave it at that. The only point we will make is that as instrument data systems (in some cases, most notably chromatography) took on the ability to support multiple instruments with a single computer, those systems took on rudimentary sample tracking capability. It wasn’t at the level of a commercial LIMS, but it was sufficient to manage multiple samples with multiple users and their worklists.
There is one point that we need to make that will apply to all the material in this book: questions that will be in the back of your mind are “How does that relate to my lab needs?” or “How can we make use of that?” Before you consider questions like that, you have to know how you want your lab to operate/function and what your requirements are. In order for you to be successful in applying products to lab work, you have to understand what problems you want to solve and how a given product's capabilities relate to them. There is always the possibility that some technology will come along and change the way you look at lab work. In order to appreciate that possibility, you have to understand your overall plan for technology usage.
Sample tracking
In the 1960s, instrument vendors and a few lab people were experimenting with interfacing computers and instruments. These systems were noted as “data stations.” In the 1970s, Perkin-Elmer Corporation began the development of a computer system to address laboratory management problems and created the first commercial LIMS. The intent of the name was to put some distance between it and the data stations it was selling and give the impression of covering all of a lab's needs. To put things into some temporal perspective, the ELN, a text-processing-heavy application, was in the future; word processors were just coming on the market. LIMS was a poor choice for a product name since users expected it to cover all “laboratory information,” including budgets, vacation schedules, documents, and any information they might have in the lab. What it did do is help track samples.
Within quality control and analytical laboratories, managing sample flow was a significant problem consuming people's time, and addressing it was a worthwhile effort (Perkin-Elmer’s – ‘P-E’ - instruments were used in chemical analysis and as a result, these labs were natural marketing targets). (The problem was described in the service lab section above and the workflow view shown in Figure 3-8.) The P-E product was the first of a long list of products to address the same issue, some with overlays to handle specific markets. One list[5] contains over one hundred products. Among the specific markets are the:
- wine industry, with its unique tests;
- food and beverage industry, with its product stability testing; and the
- pharmaceutical and biotech industries, with its formulation work (similar to stability work) concerned with environmental issues and the effectiveness of formulation over time and with different packaging/delivery systems.
Tailoring LIMS to address these activities can significantly reduce the amount of effort needed to manage testing and drastically reduce the amount of data entry required. One common application is product stability testing, as noted above.
A project is created where a series of samples are placed in controlled environments (i.e., temperature, humidity, etc.) and tested according to a schedule that can run to hundreds of sample-test combinations; a stability overlay asks some basic questions and then generates the test regime and logins needed to support the work. Without this type of application overlay, each sample would have to be logged in individually, opening the possibility of data entry errors and requiring someone to check each entry and correct mistakes, a time-consuming, labor-intensive process.
The following illustrations and descriptive text, provided and used with permission by LabLite Systems LLC, show a data entry screen (Figure 3-9a) and a search screen (Figure 3-9b).
|
|
Another is the clinical industry. One point that needs to be addressed is the difference between a LIMS and LIS. They are very similar systems in terms of function and capability. LIMS is used in a much broader market (e.g., life sciences, environmental, chemical, oil and gas, etc.), almost everywhere except clinical environments. LIS are rarely encountered outside clinical labs because of their close ties to patient records and healthcare. Some LIMS vendors will try to sell their products into clinical labs claiming that their offerings are technically more sophisticated and using current technologies. That said, there are two basic but significant differences:
- LIS is patient-centered. It is still sample tracking (with test results), but everything is tied to the patient, providing a higher level of organization. This allows a doctor to examine a patient’s records over time and by test. A LIMS is sample-oriented; samples may be part of a project (the project name would be part of the sample description) or a stability (or similar) test program. This difference is significant because of laws controlling access to patient health records and the need to coordinate a patient’s clinical results with other health and personal data. This brings us to the second difference.
- LIS supports Health Level 7 (HL7) communications. We’ll cover the details in the Standards Appendix, but the short version is this: clinical LIS has to communicate with systems both within the lab and outside of it. HL7 provides the mechanism to do that, and that isn’t supported (broadly) by LIMS. It allows LIS to "talk" to hospital administrative systems and instrument data systems, providing a foundational element to “total laboratory computing” systems. It helps things work together in ways that haven’t yet happened in the broader life sciences and industrial markets. This is a very large point and has contributed to cost reductions in laboratory testing.
The following list is a set of functions that you should expect a LIMS to support, the information is from the Laboratory, Scientific, and Health Informatics Buyer's Guide[6]:
- audit trail
- barcoding
- batching
- chain of custody
- configurable setup
- customization capabilities
- data entry
- data warehousing and mining
- document management
- electronic data exchange
- event-driven actions
- fax and email integration
- formulas
- instrument interfacing, calibration, and maintenance
- inventory
- login and accessioning
- multiple location/department support
- pairing external files to LIMS samples
- regulatory compliance
- reporting
- review and approval
- sample management and tracking
- scheduling
- training tracking
- trending and control charting
- version control
- workload management
- workflow management
A more extensive set of functions can be found in the ASTM E1578-13 standard, including those that extend beyond LIMS and LIS.[4] Both LIMS and LIS have functions that support the model in Figure 3-8. That said, there are a few additional points worth noting.
Systems provide functions for sample logins that include:
- Manual logins – reading information from forms and entering it into the system; the gains in productivity come from the ease of working with the information once it is entered. Logins also support the printing of barcoded labels with sample IDs and information you feel is relevant.
- Batch logins – being able to log in several samples with similar requirements as a group, each with its sample ID. Reduces information entry and speeds the process along.
- Remote logins – allowing submitters to log samples in.
- Scheduled logins - occuring automatically at a given frequency, producing a sample label at the remote sampling location.
Event-driven actions can be tied to the login process as well as other events. For example, if samples haven’t arrived in the lab, an “event-driven action” can notify lab personnel when the samples arrive, and their status changes from “waiting” to “in the lab.”
About the author
Initially educated as a chemist, author Joe Liscouski (joe dot liscouski at gmail dot com) is an experienced laboratory automation/computing professional with over forty years of experience in the field, including the design and development of automation systems (both custom and commercial systems), LIMS, robotics and data interchange standards. He also consults on the use of computing in laboratory work. He has held symposia on validation and presented technical material and short courses on laboratory automation and computing in the U.S., Europe, and Japan. He has worked/consulted in pharmaceutical, biotech, polymer, medical, and government laboratories. His current work centers on working with companies to establish planning programs for lab systems, developing effective support groups, and helping people with the application of automation and information technologies in research and quality control environments.
References
- ↑ "ASTM WK23265". ASTM International. Archived from the original on 10 September 2013. https://web.archive.org/web/20130910044322/http://www.astm.org/DATABASE.CART/WORKITEMS/WK23265.htm. Retrieved 05 April 2024.
- ↑ "SmartLab System Overview". VelQuest. Archived from the original on 01 January 2007. https://web.archive.org/web/20070101085646/http://www.velquest.com/notebooks/overview.asp. Retrieved 05 April 2024.
- ↑ "Lab Execution System". Accelrys. http://accelrys.com/products/process-management-and-compliance/lab-execution-system/index.html. Retrieved 15 October 2014. [dead link]
- ↑ 4.0 4.1 "ASTM E1578-13 Standard Guide for Laboratory Informatics". ASTM International. 2013. doi:10.1520/E1578-13. https://www.astm.org/e1578-13.html. Retrieved 05 April 2024.
- ↑ "LIMS vendor". LIMSwiki.org. 4 February 2015. Archived from the original on 26 February 2015. https://web.archive.org/web/20150226154945/https://www.limswiki.org/index.php/LIMS_vendor. Retrieved 05 April 2024.
- ↑ "Laboratory, Scientific, and Health Informatics Buyer's Guide". LIMSwiki. 2 February 2015. Archived from the original on 14 February 2015. https://web.archive.org/web/20150214043219/http://www.limswiki.org/index.php?title=Laboratory,_Scientific,_and_Health_Informatics_Buyer%27s_Guide. Retrieved 05 April 2024.
