Journal:Exploration of organic superionic glassy conductors by process and materials informatics with lossless graph database
| Full article title | Exploration of organic superionic glassy conductors by process and materials informatics with lossless graph database |
|---|---|
| Journal | npj Computational Materials |
| Author(s) | Hatakeyama-Sato, Kan; Umeki, Momoka; Adachi, Hiroki; Kuwata, Naoaki; Hasegawa, Gen; Oyaizu, Kenichi |
| Author affiliation(s) | Waseda University, National Institute for Materials Science |
| Primary contact | Email: oyaizu at waseda dot jp |
| Year published | 2022 |
| Volume and issue | 8 |
| Article # | 170 |
| DOI | 10.1038/s41524-022-00853-0 |
| ISSN | 2057-3960 |
| Distribution license | Creative Commons Attribution 4.0 International |
| Website | https://www.nature.com/articles/s41524-022-00853-0 |
| Download | https://www.nature.com/articles/s41524-022-00853-0.pdf (PDF) |
|
|
This article should be considered a work in progress and incomplete. Consider this article incomplete until this notice is removed. |
Abstract
Data-driven material exploration is a ground-breaking research style; however, daily experimental results are difficult to record, analyze, and share. We report a data platform that losslessly describes the relationships of structures, properties, and processes as graphs in electronic laboratory notebooks (ELNs). As a model project, organic superionic glassy conductors were explored by recording over 500 different experiments. Automated data analysis revealed the essential factors for a remarkable room-temperature ionic conductivity of 10−4 to 10−3 S cm−1 and a Li+ transference number of around 0.8. In contrast to previous materials research, everyone can access all the experimental results—including graphs, raw measurement data, and data processing systems—at a public repository. Direct data sharing will improve scientific communication and accelerate integration of material knowledge.
Keywords: materials science, materials informatics, electronic laboratory notebook, data sharing
Introduction
Materials informatics is the study of the data-oriented understanding of materials science data, represented by structures, properties, mechanisms, and protocols. [1] Artificial intelligence (AI) has been used in the field for automated material design, massive data analyses, and accelerated experiments with robots to advance the discovery of materials for energy- and environment-related applications. [1,2,3,4,5]
A long-term challenge in materials informatics and materials science is lossless data sharing by the scientific community. [6] Although materials and devices are sensitive to their preparation processes, materials databases and scientific documents generally do not provide sufficient information. [1,7,8] Most databases focus on structure–property relations and ignore or shorten the preparation protocols. [1,4,6,8] Experimental methods are available in scientific journals, but only specialists can appropriately extract the structure–property–process relationships from the text, and automated text parsing by AI is not yet practical. [7,9] Furthermore, detailed information—including non-representative experimental protocols, lot numbers of reagents, and raw measurement data—is often omitted from articles, which leaves major uncertainties about a material's data. As such, researchers may need to improve their communication style to achieve lossless material data sharing.
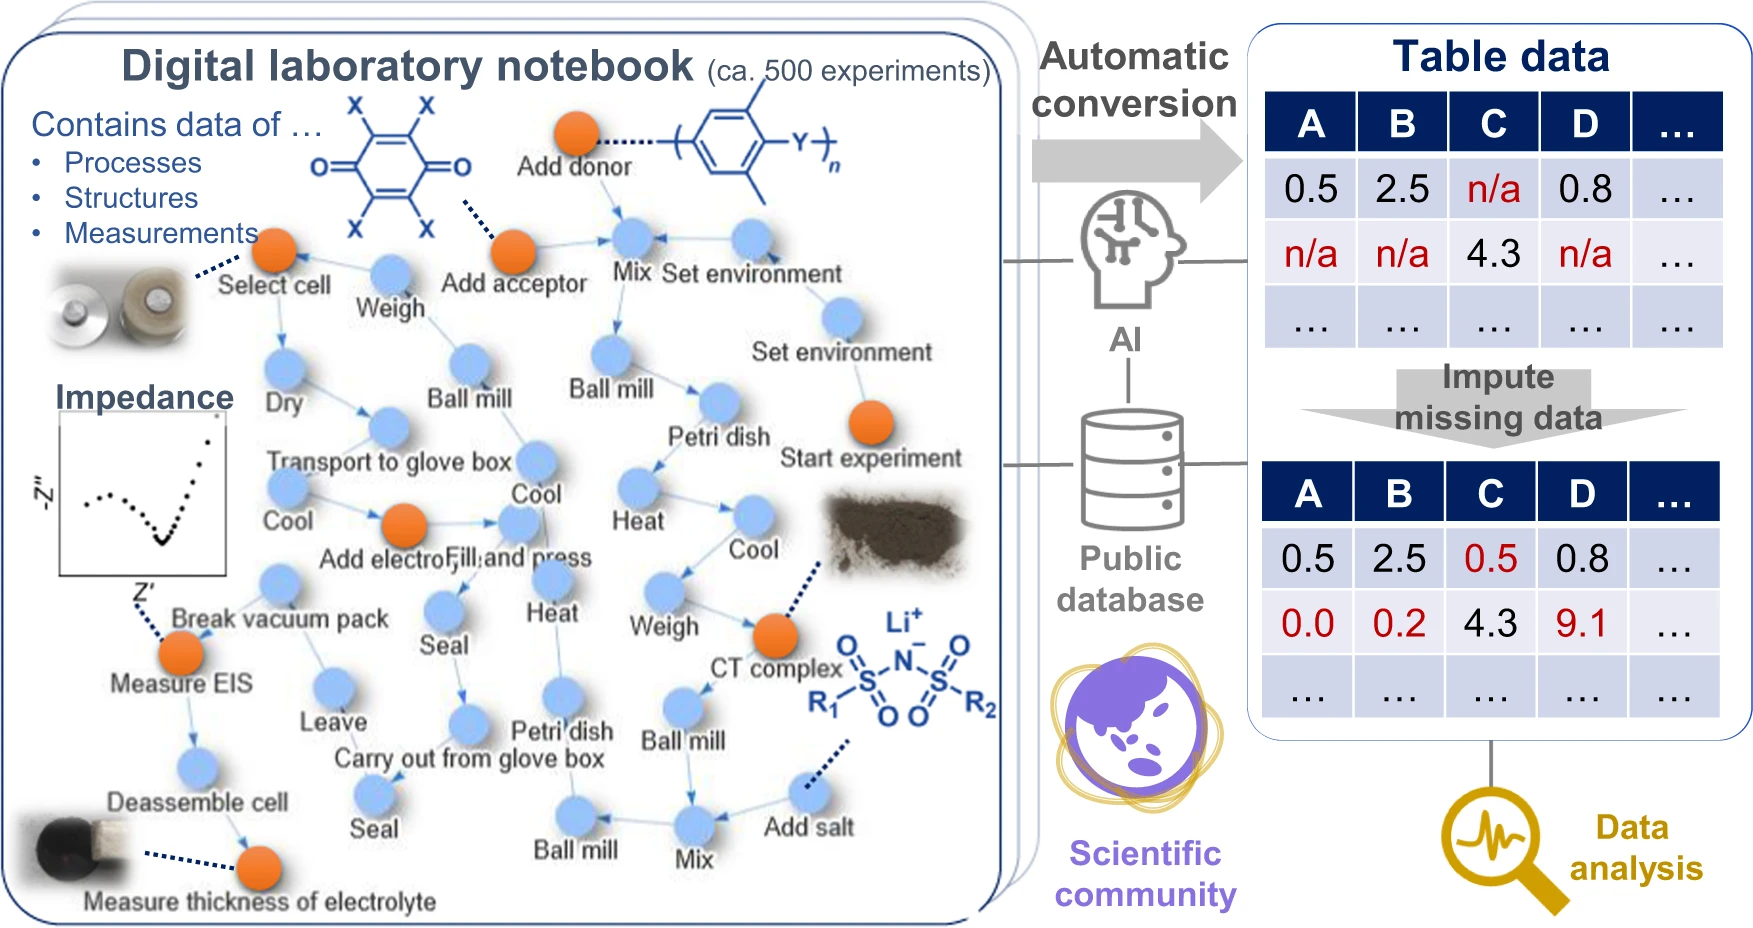
Given these factors, we propose a data platform that can explicitly describe the relations among the structures, properties, and processes of materials (Fig. 1). Based on the concepts of knowledge graphs or flowcharts [7,10], all experimental events are connected as nodes in graphs. Most experimental information can be described losslessly as graphs, the format of which is also compatible with data science. [7] We demonstrated the system by using it in our research of superionic organic conductors, which revealed the factors for achieving a remarkable room-temperature conductivity of 10−4 to 10−3 S/cm and a Li+ transference number of 0.8, practically the highest values of known tested organic solid-state conductors without plasticizers. [11,12,13,14,15] All experimental data, including everyday experimental operations and measurements (over 500 records), were recorded in the database and are available from a public repository. This work is ultimately representative of the demonstration in experimental materials science of the everything-open research style, which should become the standard for scientific communication to accelerate the integration of materials knowledge.
|
Results
Recording daily experiments as graph-shaped data
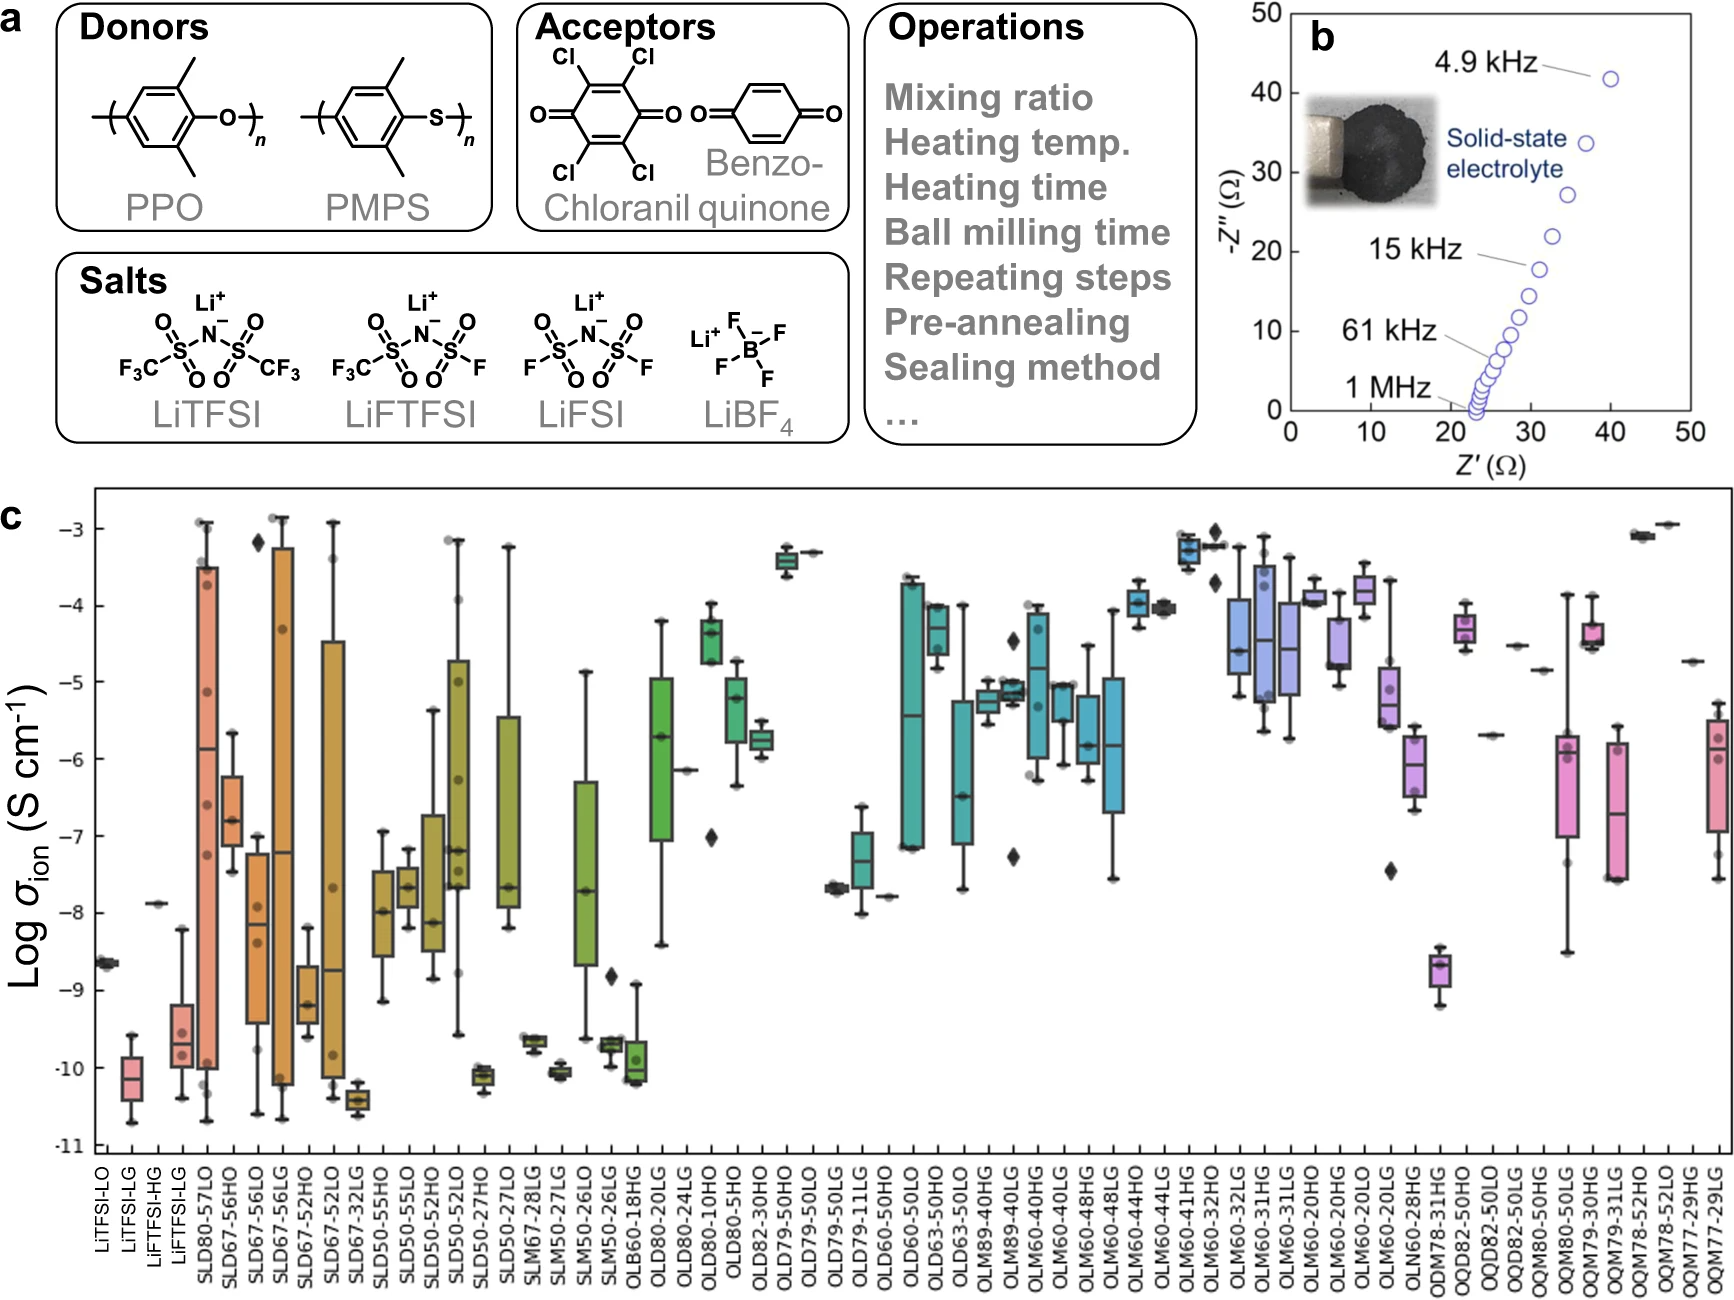
As the essential components of next-generation secondary batteries [12,13,14,16,17,18], solid-state organic lithium-ion conductors were prepared by mixing aromatic polymers, electron-accepting molecules, and lithium salts (Fig. 2a). Several candidates were virtually extracted in our previous machine learning (ML) study, using the model trained with literature data (>10,000 experimental records). [4] The model indicated a high room-temperature conductivity over 0.1 mS cm−1, and we experimentally confirmed some predictions. [4] However, the model could not input process information, even though the properties and hierarchical structures of composite materials are changed drastically by different preparation protocols. [1,7,8] The literature does not provide comprehensive experimental information for each electrolyte, mainly because of the limited space for methodology sections. This is not a problem specific to ionic conductors but has been a general limitation in materials informatics.
|
During electrolyte exploration, we used a graph database as an electronic laboratory notebook (ELN) in which we recorded the daily experiments (Figs. 1, 2b, c). ELNs are commercially available, but they are not specially designed for data science, and are only available in a closed system (i.e., proprietary model). [19] In contrast, our management system uses open-format graphs (XML data) and an open-source processing system (Supplementary Fig. 1). One graph was designed to contain almost all the information for one experiment, including experiment date, environment, experimenter, protocols, chemical formula, and a link to analytical data.
Although the electrolytes were prepared by simply mixing the components, over 40 small steps and at least 100 variable parameters could be recorded for the conductivity measurements (e.g., heating temperature, duration, and timing; Supplementary information, Supplementary Fig. 1). For each experiment, experimental protocols were changed slightly to optimize the conditions. These large numbers of steps are typical to materials science, but recording them using conventional frameworks is unmanageable. The protocols are too complex for standard process informatics tools such as experimental design and Bayesian optimization, which typically focus on less than 10 variables. [1,2,6] Only a representative protocol is usually described in the methodology section of scientific articles. In contrast, no data loss would occur in this system because every experimental result is available as graph data on the public repository.
Bridging electronic laboratory notebooks and data science
All experimental results in the project, exceeding 500 records, were recorded in the database. Unsuccessful conductors, synthesized properly but displaying poorer performances because of the unoptimized experimental procedures or compositions, were also recorded to improve ML models. We emphasize that they are often omitted from conventional scientific articles and lost from the community permanently.
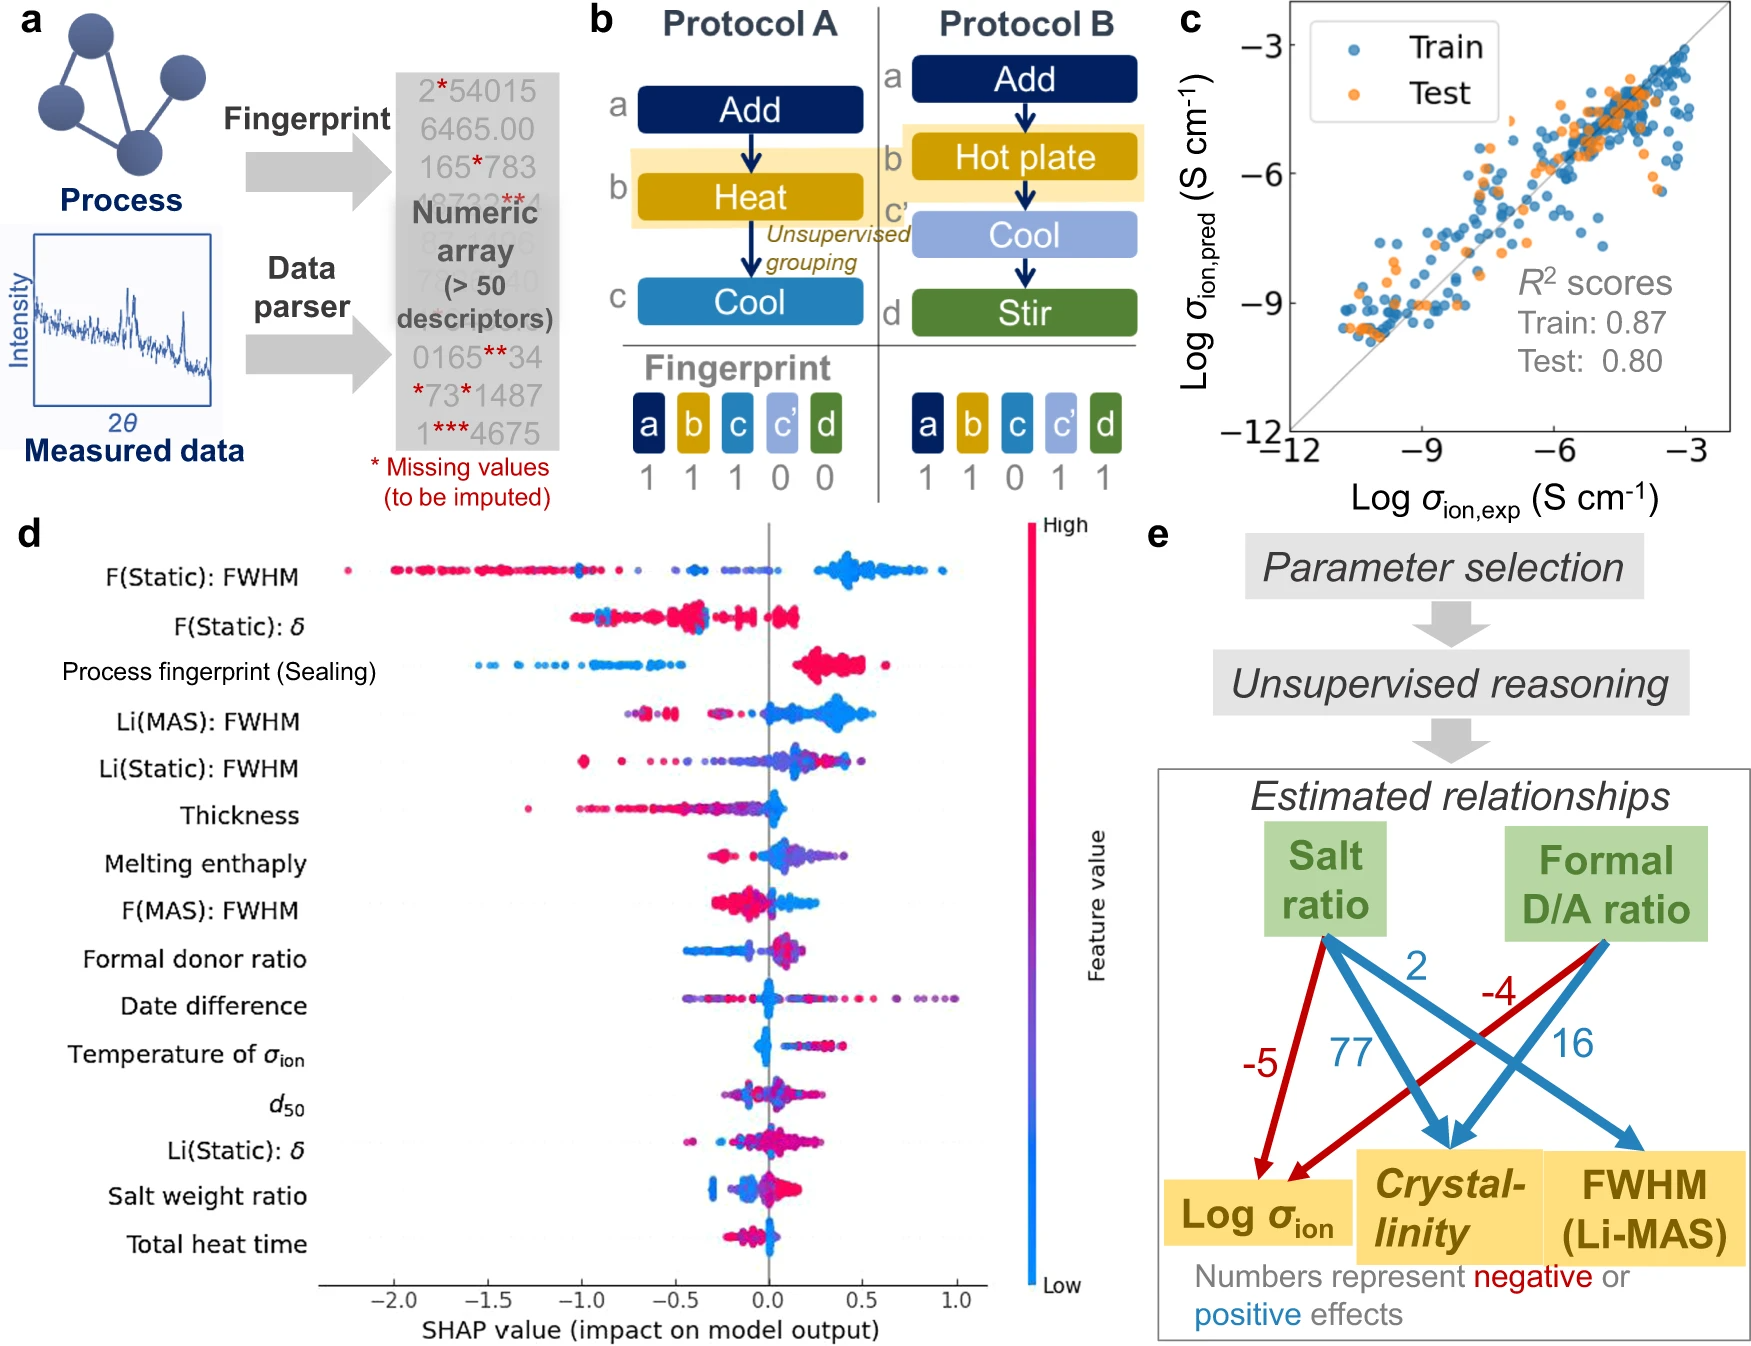
For data analysis, the raw experimental (graph) data were automatically converted into table data, which was learned by a conventional tree-based ensemble model (Supplementary information, Supplementary Fig. 2). First, the graphs were processed to a numerical array by our open-source Python module (Fig. 3a). We used a fingerprint algorithm to describe the characteristics of graphs. Fingerprint algorithms were developed to characterize the features of molecules by representing the presence of specific chemical moieties. [20] The availability of specific steps in a protocol was checked in the current algorithm (Fig. 3b, see Methods section for details). Similar operations were automatically grouped by natural language processing (BERT) [21] and unsupervised learning (k-nearest neighbour, kNN). The grouping improved the generality of the fingerprint by addressing orthographical variants (Supplementary information, Supplementary Fig. 3 and Supplementary Table 1). Individual algorithms were designed to parse chemical and measurement data to extract their characteristic features, such as molecular weight, conductivity, crystallinity, and peak position (Supplementary information, Supplementary Fig. 4).
|
Over 50 descriptors characterizing the features of processes, structures, and analytical data were automatically generated as a numerical array by parsing the database (see Supplementary information, Supplementary Fig. 5 and Supplementary Fig. 6, as well as Supplementary Table 2 and Supplementary Data). Conventional materials informatics usually requires the manual preparation of table databases from experimental results, which is time-consuming and has been a practical bottleneck in material informatics for some time. [1,7] In contrast, our system automatically converts ELNs into machine-learnable databases.
Generally, limited research resources do not allow experiments to be conducted with all-inclusive conditions, thereby leading to sparse experimental databases. [1,6,22] Missing values in the current database were filled by data imputation (Supplementary information, Supplementary Fig. 6). [7,22] In other words, the unmeasured data were generated from existing results using a LightGBM regressor, which is a standard decision tree-based ensemble model. [22,23]
During electrolyte preparation, we milled the electrolytes into microparticles. The diameter measurements were conducted only on a few samples, and the values for the other conductors were estimated by imputation (Supplementary information, Supplementary Fig. 7). The predicted diameters decreased as the milling time increased, in the same way as for the measured data, indicating successful data imputation. Although the technique is not always accurate [22], it can help researchers with objective data analysis and causal exploration.
Data-oriented analysis of electrolytes
Experimentally, various conductors were examined using the polymers poly(p-phenylene oxide) (PPO) or poly(2,5-dimethyl-1,4-phenylenesulfide) (PMPS) [24]; the electron acceptors chloranil or benzoquinone; the lithium salts lithium bis(trifluoro methanesulfonyl)imide (LiTFSI), lithium (fluorosulfonyl)(trifluoromethanesulfonyl)imide (LiFTFSI), lithium bis(fluorosulfonyl)imide (LiFSI), or lithium tetrafluoroborate (LiBF4); and different experimental protocols such as mixing and heating conditions (Fig. 2a). The conditions were selected based on our previous virtual screening [4] and on-time data analysis by the current system.
We emphasize that the introduced aromatic molecules, the scope of the database, and the informatics system differed from those related to regular aliphatic polymer electrolytes (e.g., poly(ethylene oxide) and poly(ionic liquids)). [12,15,25] The introduced aromatic polymers and electron acceptors can form charge-transfer complexes. [4,26] Their polarized structures could induce electrostatic interactions with lithium salts, generating potentially superionic phases for an unclear reason. [4,26] On the other hand, the glassy electrolytes often suffer from insufficient grain contacts; room temperature conductivities varied from almost insulating to superionic with the current electrolytes (10−11 to 10−3 S cm−1, Fig. 2b, c). We try to clarify the experimental factors affecting the conductivity and its large variance.
Critical parameters for ionic conductivity (σion) were extracted by supervised ML. Important descriptors were selected from over 50 descriptors by using the LightGBM regressor and Boruta package [27], which can choose statistically valid parameters based on hypothesis testing (Fig. 3c, d). High R2 scores of σion with the randomly split training (>0.9) and testing datasets (>0.6) indicated that the essential factors for conduction were selected adequately (Fig. 3c). About 20 descriptors remained after the filtration, the contributions of which were then quantified by SHapley Additive exPlanations (SHAP) values (Fig. 3b and Supplementary information, Supplementary Fig. 8; the scientific significance of parameters are discussed in Supplementary information, Supplementary Discussion a). [28]
We recognized the relations among the composition, conductivity, crystallinity, and nuclear magnetic resonance spectroscopy (NMR) peak width (full width at half maximum; FWHM) of the electrolytes from the SHAP analysis (Fig. 3d). The detailed causal relationships were analyzed by unsupervised ML (Fig. 3e). [29] The automated causal exploration indicated that adding polymer and acceptor molecules to salts simultaneously reduced the crystallinity, sharpened NMR peaks, and increased σion (Supplementary information, Supplementary Discussion b). Just by recording the daily exploratory experiments, essential and objective material insights could be extracted by the system.
Revealing superionic conduction
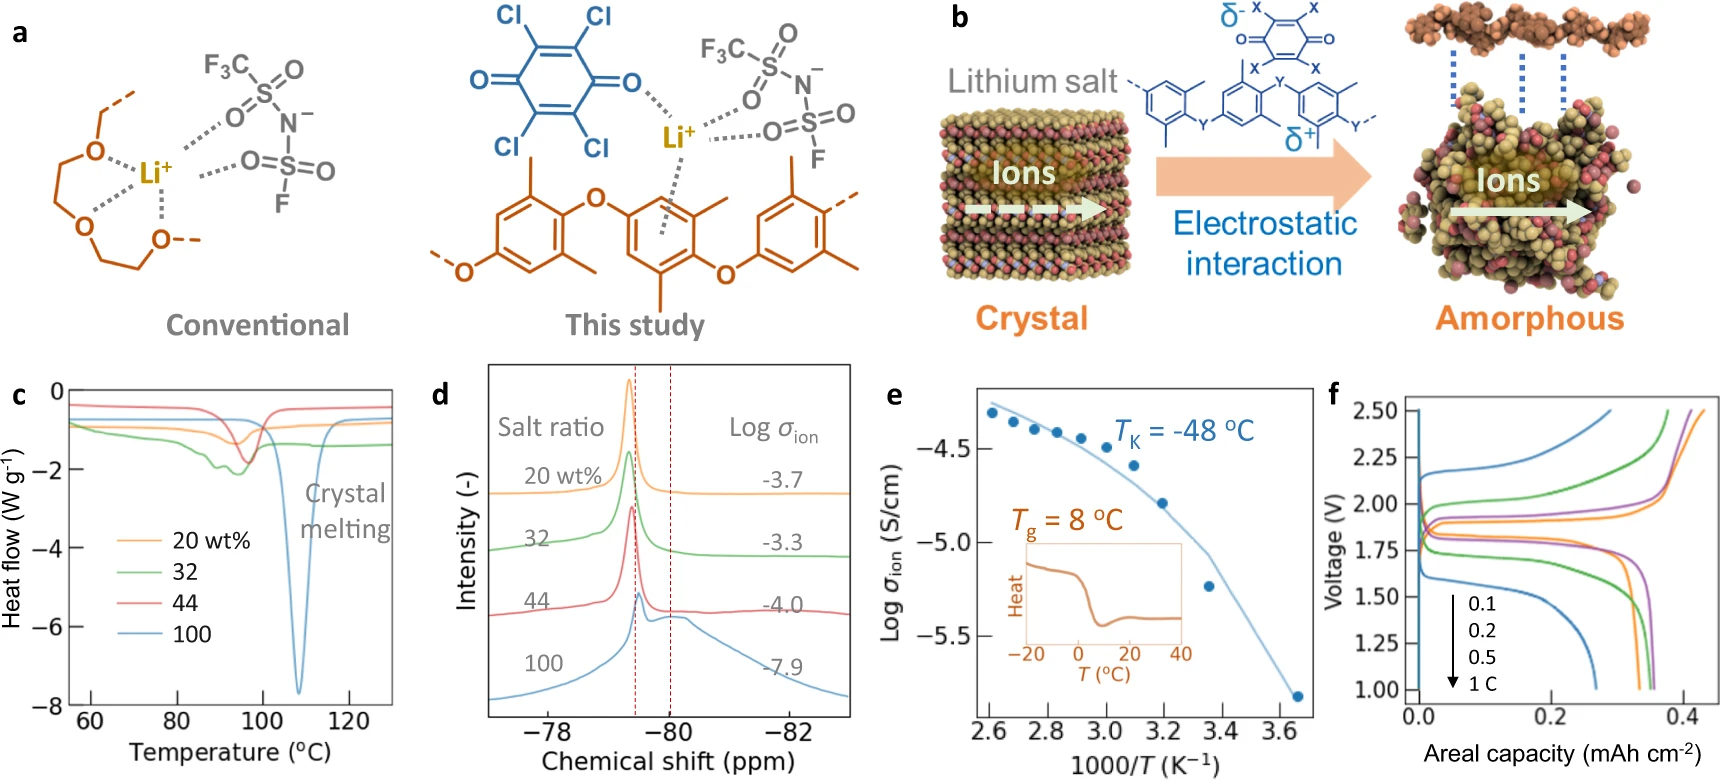
We rationalized the electrolytes’ high conductivity based on materials science. Traditionally, solid-state organic ionic conductors have been designed to contain polar and flexible aliphatic chains, represented by poly(ethylene oxide), for solvation and transportation of ions (Fig. 4a). [12,25] The solidification and overly strong cation-solvent interaction reduced the mobility of molecules, leading to a typical conductivity of 10−6 S cm−1 and lithium-ion transference number of 0.3, much smaller than liquids or recent inorganic solid conductors, which have conductivities of > 10−3 S/cm. [12,17,25]
|
An essential feature of our electrolytes is that they consist of only rigid components, namely aromatic polymers, acceptors, and lithium salts. The highly conductive yet chemically, mechanically, and thermally robust properties of our electrolytes [4] may not be achieved by other organic or inorganic conductors, which typically suffer from thermal melting, hydrolysis, or large interface resistances. [12,17] The superionic conduction in the organic glassy media must be understood from both scientific and technological perspectives to advance the practical applications of these materials (e.g., electric vehicles).
The automated causal analysis highlighted the emergence of the amorphous phase after the electrolyte preparation (Fig. 4b). The polymers (electron donors) and acceptor molecules form charge-transfer complexes [4], inducing electrostatic interactions with lithium salts (Fig. 4b, molecular calculations shown in Supplementary information, Supplementary Fig. 9 and Supplementary Fig. 10 and Supplementary Discussion c). As a representative case, electrolytes consisting of PPO/chloranil with different amounts of LiFTFSI were examined in detail (maximum conductivity of around 10−3 S cm−1; Fig. 2a). Scanning electron microscopy (SEM) and element mapping showed the uniform distribution of the polymer, acceptor, and salt as microparticles (Supplementary information, Supplementary Fig. 11). Peak shifts of the aromatic rings of the donor polymer in 13C NMR indicated molecular-level interactions between the complexes and salt (e.g., cation-π interactions[30]; Supplementary information, Supplementary Fig. 12).
X-ray diffraction (XRD) and differential scanning calorimetry (DSC) also indicated the amorphous phase formation (Fig. 4c and Supplementary information, Supplementary Figs. 13–16). After mixing with charge-transfer complexes, crystalline XRD peaks of lithium salts became smaller due to the amorphous phase transformation (Supplementary information, Supplementary Fig. 14). The transition was consistent with the fade of melting peaks after the interaction with charge-transfer complexes.
The addition of the charge-transfer complexes to salts induced unexpected sharpening of solid-state 7Li and 19F NMR peaks (Fig. 4d and Supplementary information, Supplementary Figs. 17–20). Pristine LiFTFSI displayed a broad 19F magic angle spinning (MAS) NMR peak at −80 ppm and a smaller sharp peak at around −79.5 ppm, attributed to CF3 groups. After the electrolyte formation, only smaller peaks were visible, and σion increased (Fig. 4d). Because the peak sharpening indicates the greater atom motion, the high σion was explained by the mobile ions in the amorphous phases (Figs. 3e, 4b).
The kinetics of atoms in electrolytes can be quantified by different NMR techniques, such as pulse-field gradient (PFG) NMR and relaxation time estimation. [12,31,32] PFG-NMR was unsuccessful for the electrolytes, certainly due to the interference by electron spins in charge-transfer complexes. [33] On the other hand, the fast kinetics of 7Li and 19F was successfully confirmed by relaxation time T1 [31] during static NMR measurements (Supplementary information, Supplementary Fig. 21 and Supplementary Discussion d). In contrast, carbon peaks showed no sharpening; the polymers had high glass transition temperatures (Tg) over 100 °C (Supplementary information, Supplementary Fig. 12). [4,24] The NMR results suggested that the mobile media was the salts themselves, not the polymers or acceptors (Fig. 4b).
Although pristine lithium salts have been believed to be almost insulating [12], our experimental results supported the salt-based conduction model. The temperature dependence of σion was fitted by the Vogel-Fulcher-Tammann (VFT) equation, which describes the kinetics of amorphous structures (Fig. 4e, Supplementary information, Supplementary Fig. 22). [34,35] The fitting yielded a Kauzmann temperature (TK) of −48 °C (Supplementary information, Supplementary Fig. 13b and Supplementary Discussion e). The value satisfied the empirical relation of amorphous phases, Tg ≅ TK + 5035, where Tg ≅ 0 °C–10 °C was the experimental glass transition temperature of the salt (Fig. 4e.). [36] The agreement demonstrated that the dominant carriers were amorphous salts. Molecular dynamics simulations also showed the advantages of the amorphous phase. Ions were firmly trapped in the crystalline phase, whereas structural vacancies were available in the amorphous phase (Supplementary information, Supplementary Fig. 23 and Supplementary Discussion f).
The electrolytes look dissimilar to conventional ones, but they could be regarded as a type of polymer-in-salt system, in which excess salt is added to polymers (typically over 50 wt % to an aliphatic polymer). [13,37] In the system, amorphous salt clusters, which emerge after polymer-salt interactions, function as carriers, enabling a conductivity of up to 10−4 S/cm. [13] Rubbery polymers are often used, but even high-Tg polymers (e.g., polyacrylonitrile, Tg ≅ 100 °C) can also become conductors by unexplained mechanisms. [13,38]
In the current electrolytes, electrostatic interactions of polar charge-transfer complexes and salts should have generated the amorphous clusters, similarly to conventional polymer-in-salt systems. The hypothesis is supported by the high dielectric constants of charge-transfer complexes (εr = 100–104), achieved by the partially mobile (or sometimes fully delocalized) electrons in charge-transfer complexes. [39] The species could be potentially functional as polarized groups for ion dissociation and yield higher bulk permittivity than normal solid polymer electrolytes. [4]
Kinetically, thermal (mainly rotational) motions of anions could transport cations even in the absence of flexible polymer matrices, which is unusual in normal polymeric conductors, but widely observed in ionic liquids, soft crystals, and some polymer-in-salt systems. [13,40] In our ongoing research, we intend to reveal more details of the structures and kinetics, including the possible contributions of charge-transfer complexes to salt structures, anion-acceptor exchange reactions [41], and other chemical factors (Supplementary information, Supplementary Figs. 24–25 and Supplementary Discussion g).
Next, we analyzed the best electrolyte conditions, focusing on the reproducibility of conductivity. A modified evaluation score, which was the median minus standard deviation of σion for electrolytes with the same composition, was predicted instead of each conductivity (Supplementary information, Supplementary Fig. 26). The score was low for poorly reproducible conductors with large conductivity variance. The analysis showed the importance of the following factors: a thermally stable PPO polymer; a highly dissociative and asymmetrical LiFTFSI salt; an appropriate donor/acceptor/salt ratio (e.g., donor/acceptor = 6/4 (mol/mol)+30 wt% salt); sufficient heating during electrolyte formation and premeasurement; and particle milling (Supplementary information, Supplementary Discussion h). After the optimization, high room-temperature conductivities were obtained with slight variance (e.g., 10−4 to 10−3 S cm−1 for electrolyte OLM60-41HG in Fig. 2). Thus, the materials informatics tool was suitable for technological optimization tasks.
A solid-state lithium-ion battery was fabricated using a lithium iron phosphatase cathode and a lithium titanate anode. The electrolyte consisted of PPO/benzoquinone = 8/2 with 52 wt % LiFTFSI (maximum σion≅ 10−3 S cm−1, OQM78-52 in Fig. 2). Benzoquinone was selected because of its potential chemical stability over chloranil (e.g., containing no halogens). The cell operated reversibly at 1.9 V, corresponding to the standard voltage (Fig. 4f). Although charge-transfer complexes could become electrically conducting, the composition of electrically insulating salts did not cause short circuits or current leakage (around 10−8 S cm−1). [4,26] Even at a large current density of 1.5 mA cm−2 (corresponding to 1 C), the charge/discharge reactions proceeded. The impressive performance can be explained by the electrolyte’s high Li+ transference number (ca. 0.8, estimated from the actual battery responses; Supplementary information, Supplementary Fig. 27 and Supplementary Discussion i). This high value was also an essential characteristic of the polymer-in-salt system. [13] The origin of the exceptionally high transference number must be revealed in future research.
Discussion
References
Notes
This presentation is faithful to the original, with only a few minor changes to presentation. In some cases important information was missing from the references, and that information was added.


