Journal:Usability evaluation of laboratory information systems
| Full article title | Usability evaluation of laboratory information systems |
|---|---|
| Journal | Journal of Pathology Informatics |
| Author(s) | Mathews, Althea; Marc, David |
| Author affiliation(s) | College of St. Scholastica |
| Primary contact | Email: Available w/ login |
| Year published | 2017 |
| Volume and issue | 8 |
| Page(s) | 40 |
| DOI | 10.4103/jpi.jpi_24_17 |
| ISSN | 2153-3539 |
| Distribution license | Creative Commons Attribution-NonCommercial-ShareAlike 3.0 Unported |
| Website | http://www.jpathinformatics.org |
| Download | http://www.jpathinformatics.org/temp/JPatholInform8140-5321878_144658.pdf (PDF) |
Abstract
Background: Numerous studies have revealed widespread clinician frustration with the usability of electronic health records (EHRs) that is counterproductive to adoption of EHR systems to meet the aims of healthcare reform. With poor system usability comes increased risk of negative unintended consequences. Usability issues could lead to user error and workarounds that have the potential to compromise patient safety and negatively impact the quality of care.[1] While there is ample research on EHR usability, there is little information on the usability of laboratory information systems (LIS). Yet, an LIS facilitates the timely provision of a great deal of the information needed by physicians to make patient care decisions.[2] Medical and technical advances in genomics that require processing of an increased volume of complex laboratory data further underscore the importance of developing a user-friendly LIS. This study aims to add to the body of knowledge on LIS usability.
Methods: A survey was distributed among LIS users at hospitals across the United States. The survey consisted of the 10-item System Usability Scale (SUS). In addition, participants were asked to rate the ease of performing 24 common tasks with an LIS. Finally, respondents provided comments on what they liked and disliked about using the LIS to provide diagnostic insight into the perceived usability of an LIS.
Results: The overall mean SUS score of 59.7 for the LIS evaluated is significantly lower than the benchmark of 68 (P < 0.001). All evaluated LIS received mean SUS scores below 68 except for Orchard Harvest (78.7). While the years of experience using the LIS was found to be a statistically significant influence on mean SUS scores, the combined effect of years of experience and LIS used did not account for the statistically significant difference in the mean SUS score between Orchard Harvest and each of the other evaluated LIS.
Conclusions: The results of this study indicate that overall usability of an LIS is poor. Usability lags that of systems evaluated across 446 usability surveys.
Keywords: Health information technology usability, human–computer interaction, laboratory information systems
Introduction
The Health Information Technology for Economic and Clinical Health Act was enacted in 2009 to promote the adoption of health information technology in a nationwide effort to improve the coordination, efficiency, and quality of care.[3][4] However, numerous studies have revealed widespread clinician frustration with the usability of electronic health records (EHRs) that is counterproductive to the adoption of EHR systems to meet the aims of healthcare reform. According to the survey results released by The American College of Physicians and American EHR Partners, clinician dissatisfaction with the ease-of-use of certified EHRs had increased from 23% to 37% from 2010 to 2012.[5] A 2013 RAND Corporation study sponsored by the American Medical Association found that poor usability of EHRs is a significant source of physician professional dissatisfaction.[6] Findings from a 2015 study conducted by consulting firm Accenture revealed that while 90% of the 601 physician respondents from the United States indicated that an easy-to-use data entry system is important for improving the quality of patient care, 58% of U.S. physician respondents reported that their EHRs are “hard to use.”[7]
With poor system usability comes increased risk of negative unintended consequences. Usability issues could lead to user error and workarounds that have the potential to compromise patient safety and negatively impact quality of care.[1]
While there is ample research on EHR usability, there is little information on the usability of laboratory information systems (LIS). Yet, an LIS facilitates the timely provision of a great deal of the information needed by physicians to make patient care decisions.[2] Medical and technical advances in genomics, requiring processing of an increased volume of complex laboratory data, further underscores the importance of developing a user-friendly LIS. This study aims to add to the body of knowledge on LIS usability.
Methods
Institutional Review Board approval for this study was obtained from The College of St. Scholastica. A survey was built and hosted using the online survey tool Survey Gizmo (http://www.surveygizmo.com). All responses were completely confidential, and no IP addresses or other identifying information were collected.
Survey design
To gain an accurate description of the general traits of study participants, the survey included questions on participants' LIS vendor, length of time using the LIS, job title, bed size of employing hospital, and age. Demographic questions were followed by the administration of the System Usability Scale (SUS), a well-established, highly reliable, and valid instrument in measuring usability of systems.[8][9] The SUS required respondents to rate their level of agreement/disagreement with 10 statements on a five-point Likert scale ranging from strongly disagree (1) to strongly agree (5).
LIS instructional materials developed by vendors were analyzed to compile a list of 24 basic laboratory tasks. Respondents were asked to rate the ease of performing each task on a five-point Likert scale ranging from very difficult to very easy. Respondents were asked to select N/A for any tasks not applicable to their job role.
The survey concluded with a set of questions asking participants to list three aspects of their LIS that they liked and three aspects they disliked. Participants also were asked to submit any additional comments they wished to express about their LIS' usability.
Participant selection
The survey was distributed through e-mail among pathologists, medical laboratory managers, medical laboratory technicians (MLTs), medical laboratory scientists (MLSs), and other laboratory professionals who currently use an LIS in a hospital setting to collect, process, and analyze specimens in support of patient care. The 2013 HIMSS Analytics Database was used to generate a list of names and e-mail addresses of laboratory managers and pathology department chairs/directors at hospitals across the United States. These individuals were asked to e-mail the survey invitation to their laboratory staff and colleagues. The survey also was distributed among the members of professional associations, including the Association for Pathology Informatics, American Medical Technologists (MTs), American Society of Clinical Laboratory Science, and State Associations of Pathologists. Finally, the survey was posted in medical laboratory-specific social media groups (e.g., Reddit's MedLabProfessionals subreddit, LinkedIn's Pathology Laboratory Manager Forum, the Laboratory Informatics Medical and Professional Scientific Community, the Student Doctor Network Forum, and LIS user groups).
Statistical analysis
Statistical analysis was performed in Microsoft Excel and R Studio. Surveys where the respondent answered “Never used it” to the question “How long have you used your LIS?” were disqualified from the study. In addition, surveys with incomplete SUS responses were disqualified. As the purpose of the study was to evaluate clinician and laboratory staff perceptions of usability, responses from LIS analysts and other information technology (IT) staff were excluded.
System Usability Scale scoring
A response quota of 28 for each LIS was set to have an 80% chance of detecting a 10-point difference between the benchmark mean and each LIS SUS score mean at the 95% confidence level. For each LIS yielding ≥28 responses, a composite SUS score was calculated. Responses were assigned numeric values ranging from 1 for strongly disagree to 5 for strongly agree. For each SUS set of responses, the number one was subtracted from the numeric value of each odd-numbered question. The numeric value of each even-numbered question was subtracted from the number five. The sum of these values was then multiplied by 2.5 to produce the SUS composite score, which had a possible range of 0–100.
The mean SUS score for each LIS was compared to a benchmark mean SUS score of 68, which was derived from the previous research from 446 usability surveys and over 5000 SUS responses.[10] Scores above 68 were considered above average and scores below 68 considered below average. The composite SUS scores were then converted into percentile ranks and graded on a curve to assign letter grades.[10]
To determine if demographic variables influenced SUS scores, one-way ANOVA tests were run to determine if there were statistically significant differences in mean SUS scores between respondents with different roles, ages, employing hospital sizes, and years of experience using their LIS. Finally, the overall mean SUS score for all evaluated LIS was compared to the benchmark score of 68 using one-sample, two-tailed t-tests.
Validation with KLAS Research results
To validate the observed SUS scores, the average SUS scores for each LIS were compared against the KLAS ease-of-use scores. KLAS is a widely-known research firm that collects, analyzes, and reports data reflecting the opinions of healthcare professionals on their experience with the products and services of health-care information technology vendors. The firm issues report cards for each LIS that includes a score for ease-of-use. Using a simple linear regression, the ease-of-use scores from KLAS report cards compiled from data collected from August 2015 to August 2016 were compared with the SUS scores for each LIS evaluated in this study to determine if the SUS scores trended in the same direction as KLAS scores.
Task ratings analysis
To analyze the ratings of the ease of performing the 24 common laboratory tasks, the frequency of each response for each task was calculated to determine the top three tasks rated “very difficult” and top three tasks rated “difficult” for each LIS. The responses also were analyzed to determine what tasks were most frequently rated either “very difficult” or “difficult” across all LIS. Conversely, the data were analyzed to determine the top three tasks rated “very easy” and top three tasks rated “easy” for each LIS and across all LIS.
Free text analysis
Respondents were asked to name three things they liked about using an LIS, three things they disliked about using a LIS, and provide any additional comments regarding their experience with an LIS. QI Macros software (by KnowWare International, Inc., Denver, Colorado) was used in Microsoft Excel to generate word counts and two-word phrase counts to identify themes in the free-text responses. The frequency of the themes was calculated.
Results
Respondent demographics
Respondent roles
There were 327 responses to the survey. Of the total responses, there were 259 qualifying responses analyzed. Sixty-six respondents (25.5%) were laboratory managers, 49 (18.9%) were MLS, 47 (18.1%) were MT, 35 (13.5%) were MLT, and 32 (12.4%) were pathologists. The remaining participants were phlebotomists (7, 2.7%), residents (6, 2.3%), cytotechnologists (5, 1.9%), fellows (3, 1.2%), a health information manager (1, 0.4%), histology technicians (2, 0.8%), processing technicians (2, 0.8%), laboratory supervisors (2, 0.8%), a laboratory assistant (1, 0.4%), and a registered nurse (1, 0.4%).
Hospital size
Just over half of the respondents (54%) reported that they work at a hospital with 400 or more beds. Eight percent are employed at a hospital with 250–399 beds, 14% work in a hospital with 100–249 beds, and 24% work in a hospital with <100 beds.
Age
Ninety-four (36.3%) of respondents were 50–59 years of age, 52 (20.1%) were 30–39 years of age, 46 (17.8%) were 40–49 years of age, 39 (15.1%) were 60–69 years of age, 25 (9.7%) were 18–29 years of age, and one respondent was 80–89 years of age. There were no respondents aged 70–79, and two respondents did not give their age.
Years using the laboratory information system
Most respondents (43.6%) reported using an LIS for five or more years. Fifty-five (21.2%) have been using an LIS for three to four years, 52 (20.1%) have been using an LIS for one to two years, and 39 (15.1%) have been using an LIS for less than one year.
System Usability Scale scores
The overall mean SUS score for all evaluated LIS was 59.7. The one-sample, two-tailed t-test revealed that this mean score is significantly lower than the benchmark score of 68 (P< 0.001).
A one-way ANOVA (F-value =0.806, P = 0.686) revealed no significant difference in mean SUS scores between the role of the participant, and a two-way ANOVA revealed no evidence of a statistically significant interaction effect (P = 0.389) of the independent variables of the LIS used and respondent role on mean SUS scores. Similarly, a one-way ANOVA (F-value = 1.156, P = 0.327) revealed no significant difference in mean SUS scores between respondents from different hospital sizes, and a two-way ANOVA revealed no evidence of a statistically significant interaction effect (P = 0.198) of the independent variables of LIS used and hospital size on mean SUS scores. A one-way ANOVA (F-value =2.021, P =0.063) revealed that there was not a significant difference in mean SUS scores between the age brackets.
The mean SUS score was higher for respondents who have been using their LIS for five or more years as compared to the other duration groups, as shown in Table 1.
|
A one-way ANOVA (F-value=11.18, P< 0.001) revealed a significant difference in mean SUS scores between different lengths of time using the LIS. A Tukey post hoc test conducted on all possible pairwise contrasts revealed that the mean SUS score for respondents who have used their LIS for five or more years was statistically different than the mean SUS score for those who have used their LIS less than a year (P< 0.001), one to two years (P< 0.001), and three to four years (P = 0.028). A two-way ANOVA revealed no evidence of a statistically significant interaction effect (P = 0.146) of the independent variables of LIS used and respondents' years of experience using the LIS on mean SUS scores.
System Usability Scale scores by laboratory information system
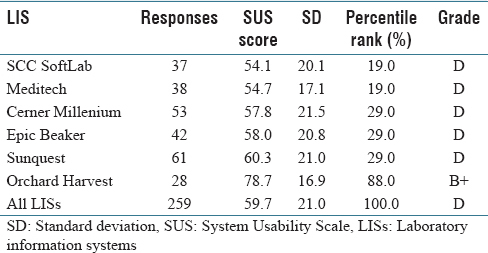
A one-way ANOVA (F-value =6.227, P< 0.001) revealed that there is a significant difference in mean SUS scores between the different LIS. A Tukey post hoc test conducted on all possible pairwise contrasts revealed that the mean SUS score for Orchard Harvest was statistically greater than that of Cerner Millenium (P< 0.001), Epic Beaker (P< 0.001), Meditech (P< 0.001), SCC SoftLab (P< 0.001), and Sunquest (P = 0.001). The raw SUS scores were converted into percentile ranks based on the SUS benchmark of 68 and graded on a curve to assign a letter grade, as shown in Table 2.
|
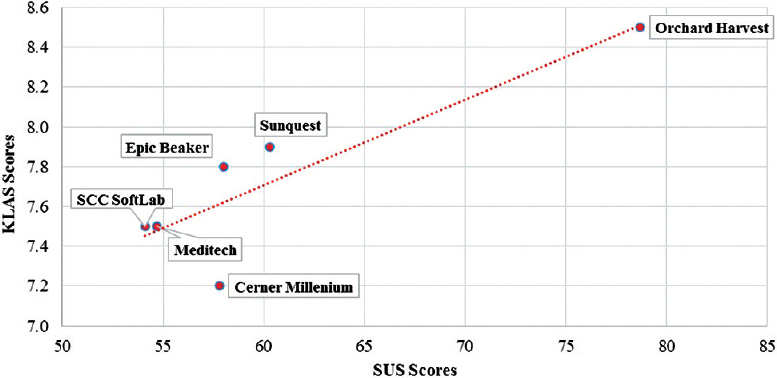
A linear regression was performed to determine if the SUS mean scores from this study and KLAS research firm's ease-of-use scores for LIS from August 2015 to August 2016 trended in the same direction. Apart from Cerner Millenium, the residuals of the scores were minimal when compared to the best-fit line. As shown in Figure 1, there is a significant strong positive association between the SUS scores and KLAS ease-of-use scores (P = 0.02, r2 = 0.766).
|
Task analysis
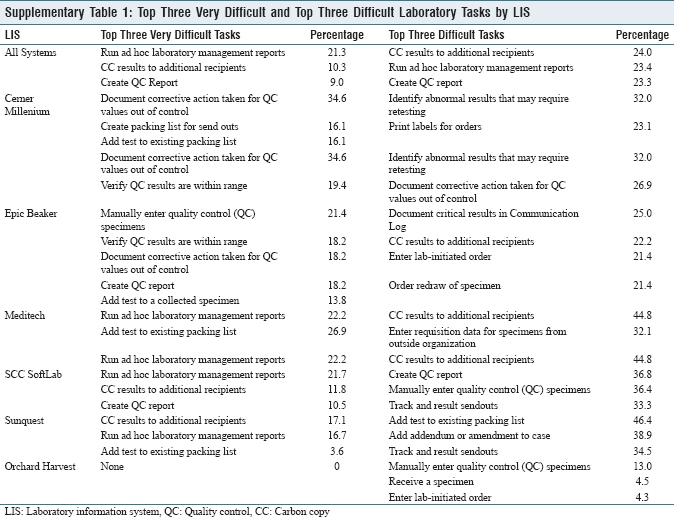
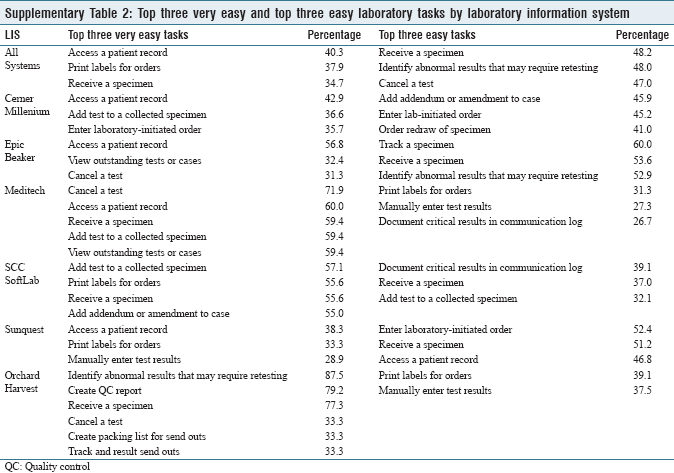
The top three tasks ranked “very difficult” were running ad hoc laboratory management reports (21.3%), copying results to additional recipients (10.3%), and creating quality control (QC) reports (9.0%). Copying results to other participants (24%), running ad hoc laboratory management reports (23.4%), and creating QC reports (23.3%) were the top three tasks ranked “difficult” by survey respondents.
Copying results to additional recipients was considered “very difficult” or “difficult” across five LIS, while adding tests to existing packing lists, creating QC reports, and running ad hoc laboratory management reports were considered “very difficult” or “difficult” across four of the evaluated LIS. The top three tasks ranked “very easy” were accessing a patient record (40.3%), printing labels for orders (37.9%), and receiving a specimen (34.7%). The top three tasks ranked “easy” were receiving a specimen (48.2%), identifying abnormal results that may require retesting (48.0%), and canceling a test (47.0%). Accessing a patient record was ranked “very easy” across five LIS, while receiving a specimen was considered “very easy” or “easy” across four LIS. See Supplementary Table 1 and Supplementary Table 2 for a breakdown of task ratings by LIS.
|
|
Text analysis
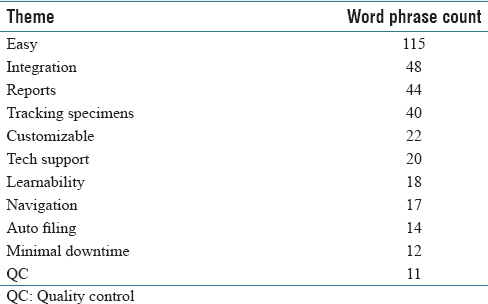
The word counts and two-word phrase counts from the free text responses revealed the following themes related to what respondents liked about using their LIS: integration with other systems, reports, and tracking specimens. Customizability, technical support, learnability, and ease of navigation were also cited, as well as auto-completion of results, minimal downtime, and QC features. The word “easy” was prevalent in the two-word phrase counts, as shown in Table 3.
|
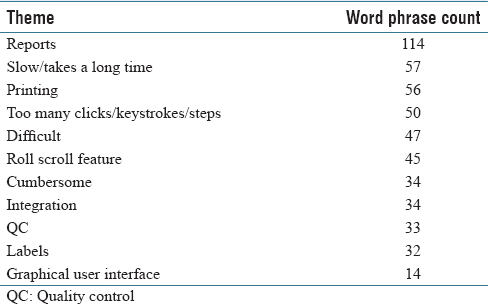
Reports, slow/takes a long time, printing, and too many clicks/keystrokes/steps to perform tasks were prevailing themes in response to the question of what respondents disliked about using their LIS, as well as roll scroll navigation, lack of integration with other systems, QC features, creating labels, and the graphical user interface (GUI). The words “difficult” and “cumbersome” were prevalent in the two-word phrase counts, as shown in Table 4.
|
Conclusions
The overall mean SUS score of 59.7 for the LIS evaluated in this study is significantly lower than the benchmark of 68 (P< 0.001), indicating that usability of an LIS is quite poor compared to various systems that have been evaluated using the SUS. When the SUS scores converted to letter grades, all evaluated LIS received a failing “D” grade except for Orchard Harvest (B+). Overall, the scores of each LIS evaluated in this study trended in the same direction as KLAS research firm's ease-of-use scores, with Cerner Millenium being an exception.
The respondent role, employing hospital size, and age were not statistically significant factors influencing mean SUS scores, nor were the combined effect of respondent role and LIS and employing hospital size and LIS. Years of experience using the LIS was found to be a statistically significant influence on mean SUS scores. This is consistent with the results from usability researcher Sauro, who – when examining 800 SUS responses regarding the usability of 16 popular consumer software products – found that mean SUS scores increased 11% from users who were the least experienced with the products and users who were the most experienced.[10] However, the combined effect of years of experience and the LIS used did not account for the statistically significant difference in the mean SUS score between Orchard LIS and each of the other evaluated LIS. Further research is warranted to determine the root cause(s) of the difference in perceived usability.
The top three tasks that respondents found most difficult to perform were running ad hoc laboratory management reports, copying results to additional recipients, and creating QC reports. In addition, “reports” were the most cited word in the text analysis of responses to the query of what participants disliked about using their LIS.
While running ad hoc laboratory management reports was rated one of the top three tasks most difficult to perform, this task may be most frequently performed by LIS analysts, who were excluded from this study. The intent of this study was to capture the perspective of laboratory professionals who currently use an LIS to collect, process, and analyze specimens. LIS analysts involved in the analysis, design, and implementation of an LIS are likely not currently involved in the day-to-day handling of specimens. However, the exclusion of analysts may have been an influencing factor in the rating of this task.
The implications of the difficulty of copying results to additional recipients may be worthy of further study. This task was found difficult by users of five of the evaluated LIS. Inability to easily share laboratory results could potentially impact the quality of care as it directly impacts care coordination, particularly in instances of transition of care.
This study is also limited by the exclusion of version numbers from the analysis. At least one evaluated LIS (Sunquest) has been transitioning from a terminal-based roll and scroll environment to a GUI environment, and usability of these two distinct environments may be significantly different.
An important observation is the overlap in the dislikes and likes cited by users in the study. While reports, integration, and QC were in the list of top 10 response themes for qualities respondents liked about using their LIS, these three themes also were in the list of top 10 response themes for qualities respondents disliked about using their LIS. This could be a line of future inquiry as a more sophisticated text analysis could offer insight into this overlap.
Interestingly, themes discovered in the free text responses to the queries of what users liked and disliked about their LIS echoed those of EHR users recently surveyed by the Healthcare Information and Management Systems Society (HIMSS). In a 2014 HIMSS EHR Usability Pain Point Survey, providers were dissatisfied with the frequency of mouse clicks, data placement and presentation, and hidden information (GUI issues), lack of interoperability, slow response time, and difficulty using the system for provider-to-provider communication.[11] The mention of too many clicks/keystrokes/steps, GUI shortcomings, interface (operability), slow/takes a long time, and copying results to additional recipients in the free text responses of this LIS usability study echo the HIMSS survey responses. “Cumbersome” and “too many clicks/keystrokes/steps” were phrases prevalent in this study, repeating 2015 HIMSS User Satisfaction Survey responses.[12] This suggests that the same usability issues found in EHR systems carry over to an LIS.
From the results of this study, it can be concluded that usability of an LIS is poor. Usability lags overall usability of systems evaluated across 446 usability surveys and appears to not be any better – if not worse – than that of EHR usability.
Financial support and sponsorship
Nil.
Conflicts of interest
There are no conflicts of interest.
References
- ↑ 1.0 1.1 Bowman, S. (2013). "Impact of electronic health record systems on information integrity: Quality and safety implications". Perspectives in Health Information Management 10: 1C. PMC PMC3797550. PMID 24159271. https://www.ncbi.nlm.nih.gov/pmc/articles/PMC3797550.
- ↑ 2.0 2.1 Harrison, J.P.; McDowell, G.M. (2008). "The role of laboratory information systems in healthcare quality improvement". International Journal of Health Care Quality Assurance 21 (7): 679-91. doi:10.1108/09526860810910159. PMID 19055276.
- ↑ "HITECH Act Enforcement Interim Final Rule". U.S. Department of Health & Human Services. https://www.hhs.gov/hipaa/for-professionals/special-topics/HITECH-act-enforcement-interim-final-rule/index.html. Retrieved 30 April 2016.
- ↑ "How does information exchange support the goals of the HITECH Act?". HealthIT.gov. U.S. Department of Health & Human Services. https://www.healthit.gov/policy-researchers-implementers/faqs/how-does-information-exchange-support-goals-hitech-act. Retrieved 30 April 2016.
- ↑ "Survey of Clinicians: User satisfaction with electronic health records has decreased since 2010". American College of Physicians. 5 March 2013. https://www.acponline.org/acp-newsroom/survey-of-clinicians-user-satisfaction-with-electronic-health-records-has-decreased-since-2010. Retrieved 30 April 2016.
- ↑ Friedberg, M.W.; Chen, P.G.; Van Busum, K.R. et al. (2013) (PDF). Factors Affecting Physician Professional Satisfaction and Their Implications for Patient Care, Health Systems, and Health Policy. The RAND Corporation. pp. 123. ISBN 9780833082206. https://www.rand.org/content/dam/rand/pubs/research_reports/RR400/RR439/RAND_RR439.pdf.
- ↑ "2015 Doctors Survey on Health IT". Accenture. 2015. https://www.accenture.com/us-en/insight-accenture-doctors-survey-2015-healthcare-it-pain-progress. Retrieved 30 April 2016.
- ↑ Brooke, J. (2013). "SUS: A retrospective". Journal of Usability Studies 8 (2): 29–40.
- ↑ "System Usability Scale (SUS)". Usability.org. U.S. Department of Health & Human Services. https://www.usability.gov/how-to-and-tools/methods/system-usability-scale.html. Retrieved 24 April 2016.
- ↑ 10.0 10.1 10.2 Sauro, J. (2011). A Practical Guide to the System Usability Scale: Background, Benchmarks & Best Practices. CreateSpace Independent Publishing Platform. pp. 162. ISBN 9781461062707.
- ↑ Schlossman, D.; Schumacher, R.M. (12 June 2014). "HIMSS EHR Usability Pain Point Survey Results" (PDF). HIMSS. http://www.himss.org/sites/himssorg/files/FileDownloads/Physician%20Webinar%20Series%202013-2014%20Schlossman%20&%20Schumacher.pdf. Retrieved 26 August 2016.
- ↑ Miliard, M. (10 March 2016). "Frustrations linger around electronic health records and user-centered design". Healthcare IT News. HIMSS Media. http://www.healthcareitnews.com/news/frustrations-linger-around-electronic-health-records-and-user-centered-design. Retrieved 26 August 2017.
Notes
This presentation is faithful to the original, with only a few minor changes to presentation and updates to spelling and grammar. In some cases important information was missing from the references, and that information was added.

